View methods side by side.
Choose up to four methods. Add them using the search and share the comparison by copying its link.
| Criterion |  UX Design Storyboarding | 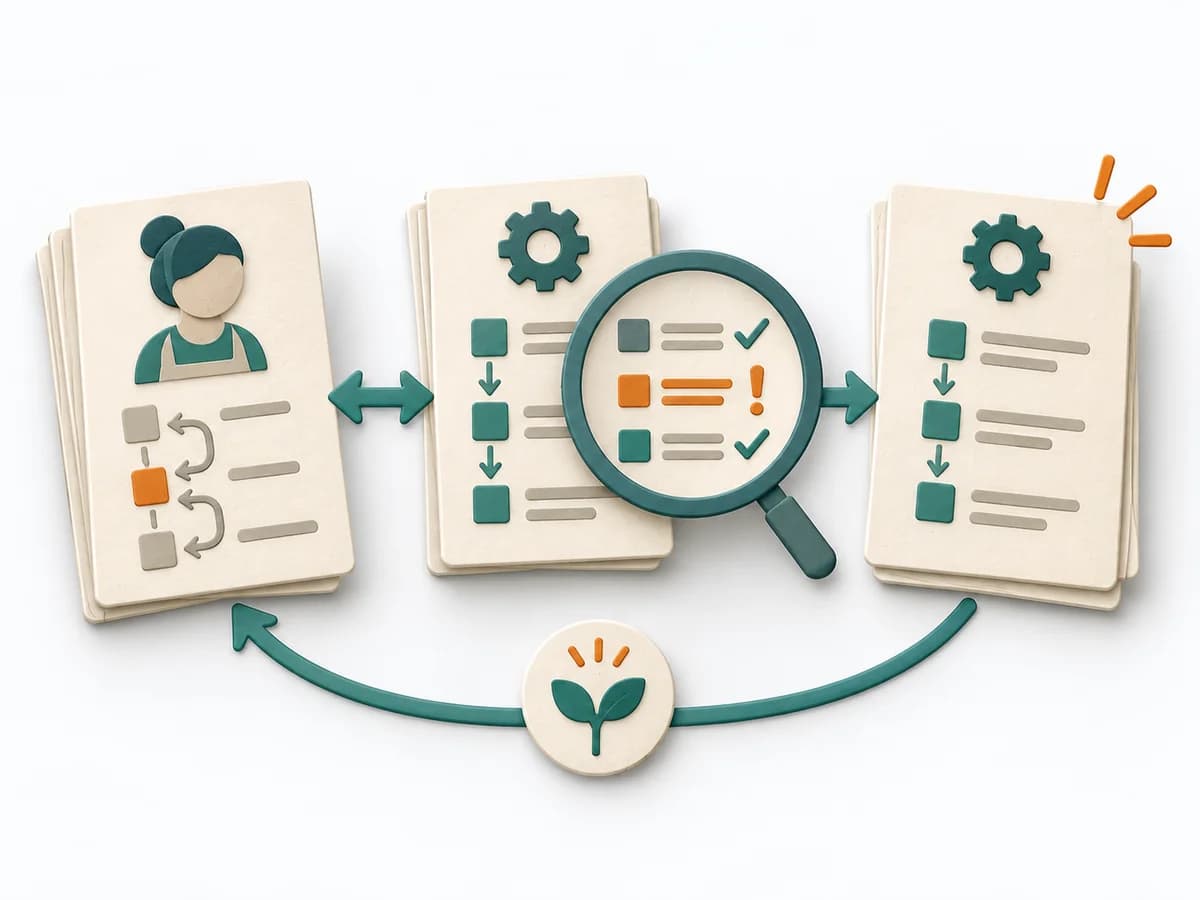 Operations Standard Work Analysis |  Operations Failure Mode and Effects Analysis | 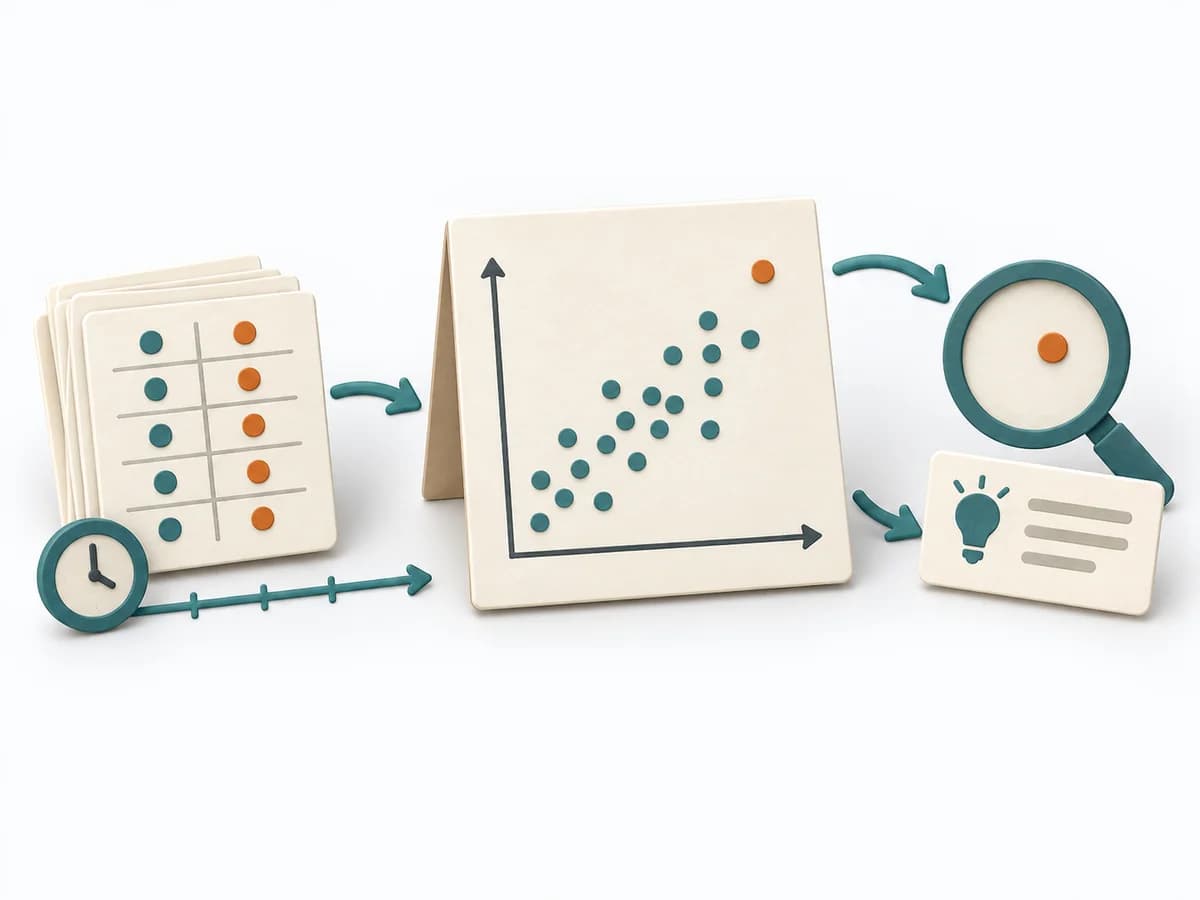 Operations Scatter Diagram |
|---|---|---|---|---|
Purposedifferent | When a usage scenario needs to become understandable early, it condenses situations, context, and flow into a legible sequence. It helps check concept ideas before anything gets built. | When the same task is done differently depending on the person, the method exposes the reliable core. It creates comparability without unnecessarily choking off needed latitude. | For a process, product, or service with noticeable failure risks, the method assesses possible failure modes in advance. It directs attention to combinations of occurrence, effect, and detectability. | When the question is whether two measures are related, the method makes patterns in the data picture visible. It separates felt correlations from relationships that actually show up in the data. |
Complexitydifferent | Medium | Medium | High | Low |
Timedifferent | 30-90 min | 1-3 h | 2-6 h | 30-90 min |
Participantsdifferent | 1-8 | 2-6 | 3-10 | 1-4 |
Formatdifferent | Workshop + async | Workshop | Workshop | Workshop + async |
Outputdifferent | Storyboard, Concept Narrative, Testable Assumptions | Standard Work Sheet, Deviation List, Improved Standard, Training Needs | FMEA Table, Risk Priority, Mitigation Actions | Scatter Plot, Korrelationsnotiz, Hypothesenliste |
Tagsno overlap | VisualizationConceptsSequencePrototype | LeanProcessQuality | RiskQualityOperationsRoot cause | Root causeQualityVisualization |