View methods side by side.
Choose up to four methods. Add them using the search and share the comparison by copying its link.
| Criterion |  Agile Story Points | 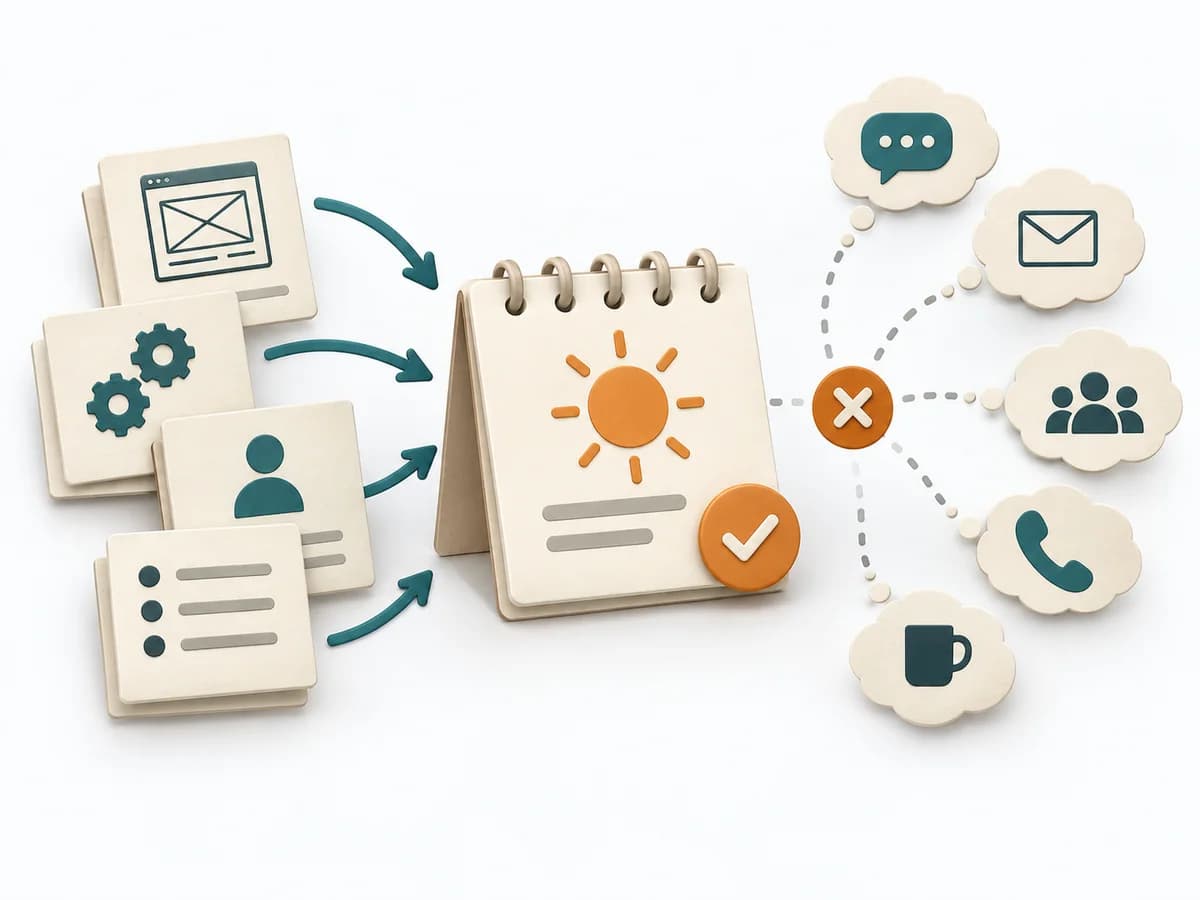 Agile Ideal Days |  Team Design Team Topologies Interaction Modes | 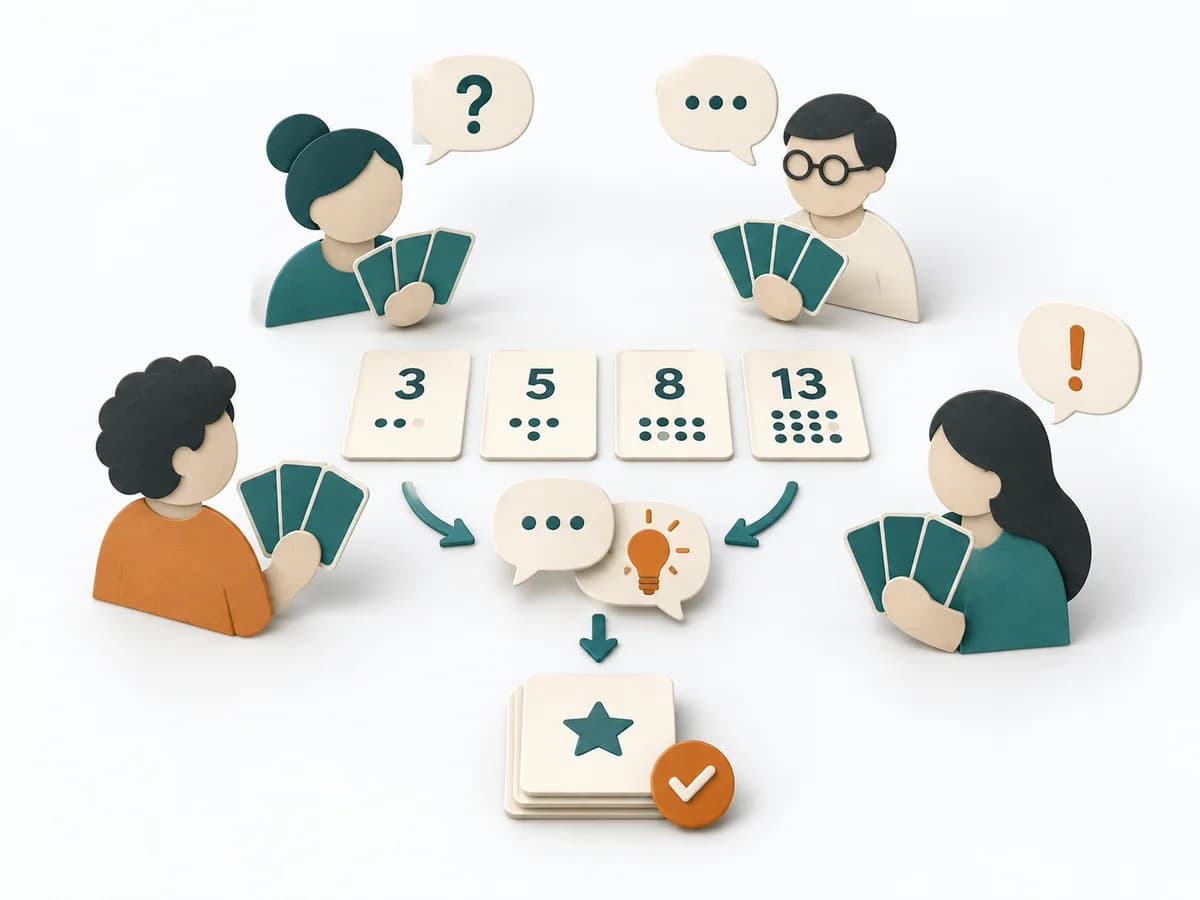 Agile Planning Poker |
|---|---|---|---|---|
Purposedifferent | When teams want to rate complexity rather than hours, it creates a shared, relative scale. It sorts work by value, risk, and delivery ability. The result is captured as Point Estimates, Reference Stories, and Velocity Data. | When effort needs to be thought of as real working time, it offers a simple common denominator for comparison. It sorts work by value, risk, and delivery ability. The result is captured as Ideal Day Estimates, Assumption Notes, and Capacity Caveats. | When several teams collaborate repeatedly, it describes the right interaction mode for each interface between them. It clarifies responsibility, interaction, and load between teams. The result is captured as an interaction heat map and pairwise agreements. | When estimates within the team diverge too much, it puts differing expectations on a common test bench. It separates rough complexity from unspoken assumptions. |
Complexitydifferent | Medium | Low | Medium | Low |
Timedifferent | laufend, 1-5 min je Item | 15-60 min | Half day | 2-5 min je Item |
Participantsdifferent | 3-9 | 2-9 | Team-Leads plus Architecture | 3-9 |
Formatdifferent | Workshop + async | Workshop + async | Workshop | Workshop + async |
Outputdifferent | Point Estimates, Reference Stories, Velocity Data | Ideal Day Estimates, Assumption Notes, Capacity Caveats | Interaction Heat Map, Agreements per Pair | Relative Estimates, Assumption Notes, Split Candidates |
Tagsno overlap | EstimationAgileMeasurement | EstimationEffortAgile | TeamAlignmentCollaborationOrganization | EstimationAgileRelative sizingTeam |