View methods side by side.
Choose up to four methods. Add them using the search and share the comparison by copying its link.
| Criterion |  Agile Story Points | 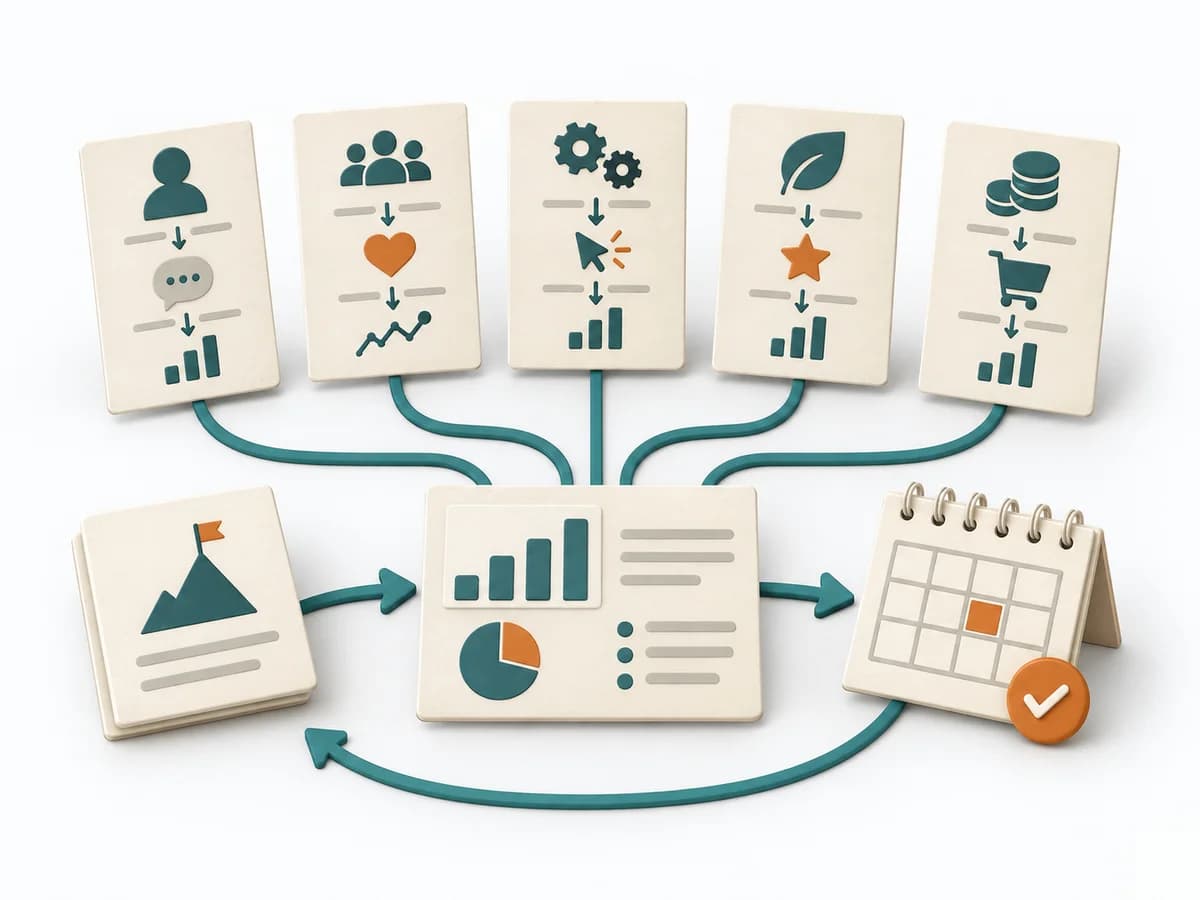 UX Research HEART Framework |  Facilitation Dot Estimation |
|---|---|---|---|
Purposedifferent | When teams want to rate complexity rather than hours, it creates a shared, relative scale. It sorts work by value, risk, and delivery ability. The result is captured as Point Estimates, Reference Stories, and Velocity Data. | Helps clarify observations, needs, and patterns in concrete terms. It groups observations into patterns, questions, and decisions. The result is captured as a HEART-GSM table and dashboard. | When size or effort can only be estimated roughly, Dot Estimation condenses the group's experience into a quick range. It turns individual contributions into a visible selection. The result is captured as an Effort Heatmap, Risk Signals, and Discussion Targets. |
Complexitydifferent | Medium | Medium | Low |
Timedifferent | laufend, 1-5 min je Item | 120 min initial, dann laufend | 5-20 min |
Participantsdifferent | 3-9 | 3-6 | 3-20 |
Formatdifferent | Workshop + async | Workshop + async | Workshop |
Outputdifferent | Point Estimates, Reference Stories, Velocity Data | HEART-GSM Table, Dashboard | Effort Heatmap, Risk Signals, Discussion Targets |
Tagsno overlap | EstimationAgileMeasurement | MetricsUX researchMeasurementSatisfaction | EstimationEffortRisk |
Often compared together
Methods with strong topical overlap with the current selection, not yet in the comparison.