View methods side by side.
Choose up to four methods. Add them using the search and share the comparison by copying its link.
| Criterion | 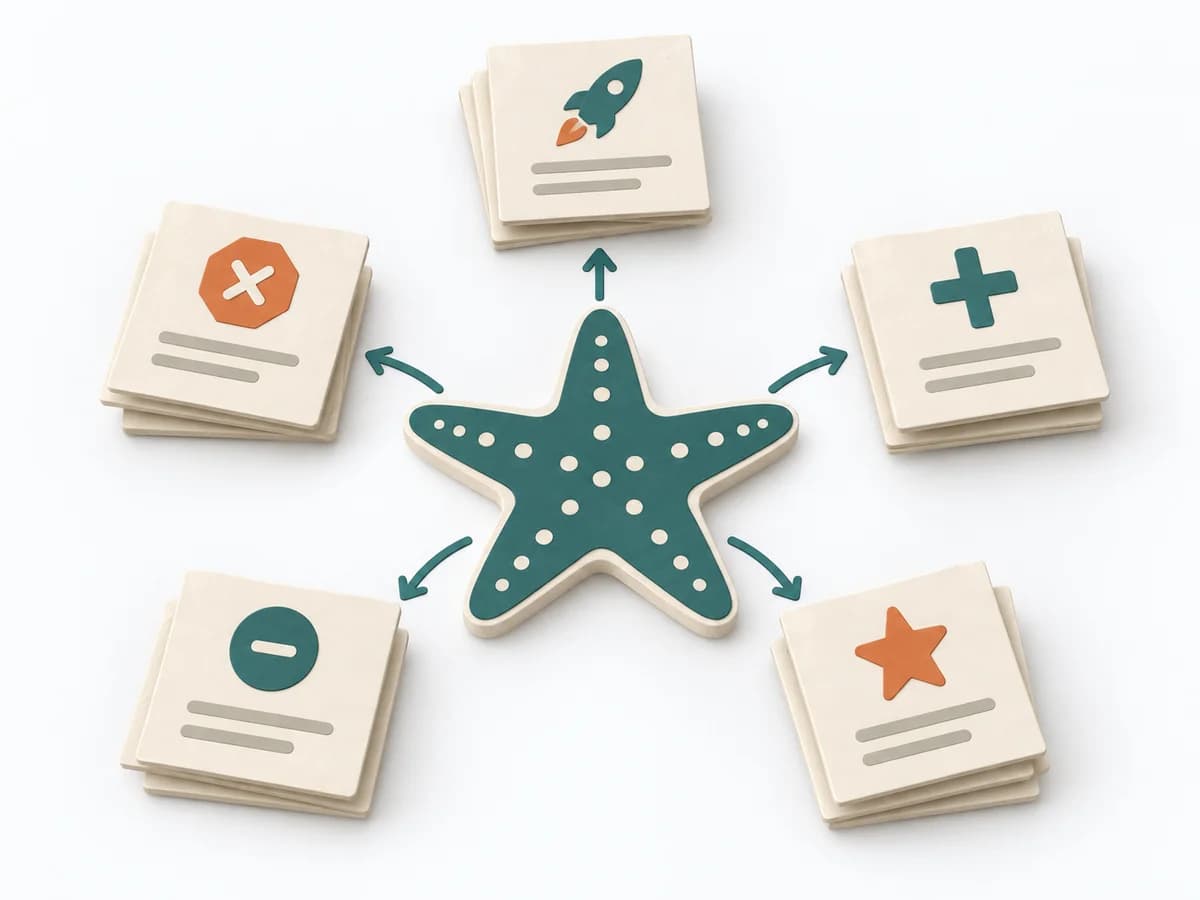 Agile Starfish Retrospective |  UX Research Customer Journey Mapping | 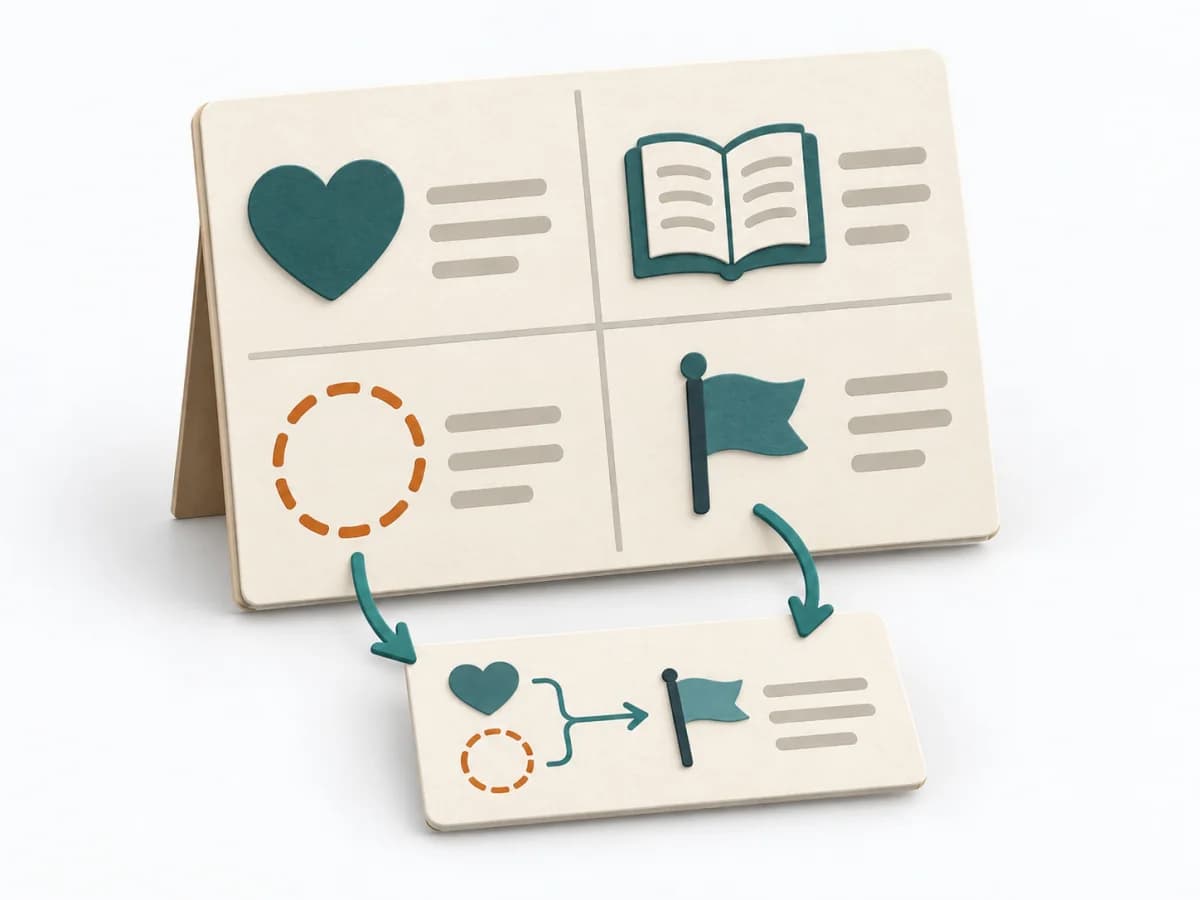 Agile 4Ls Retrospective | 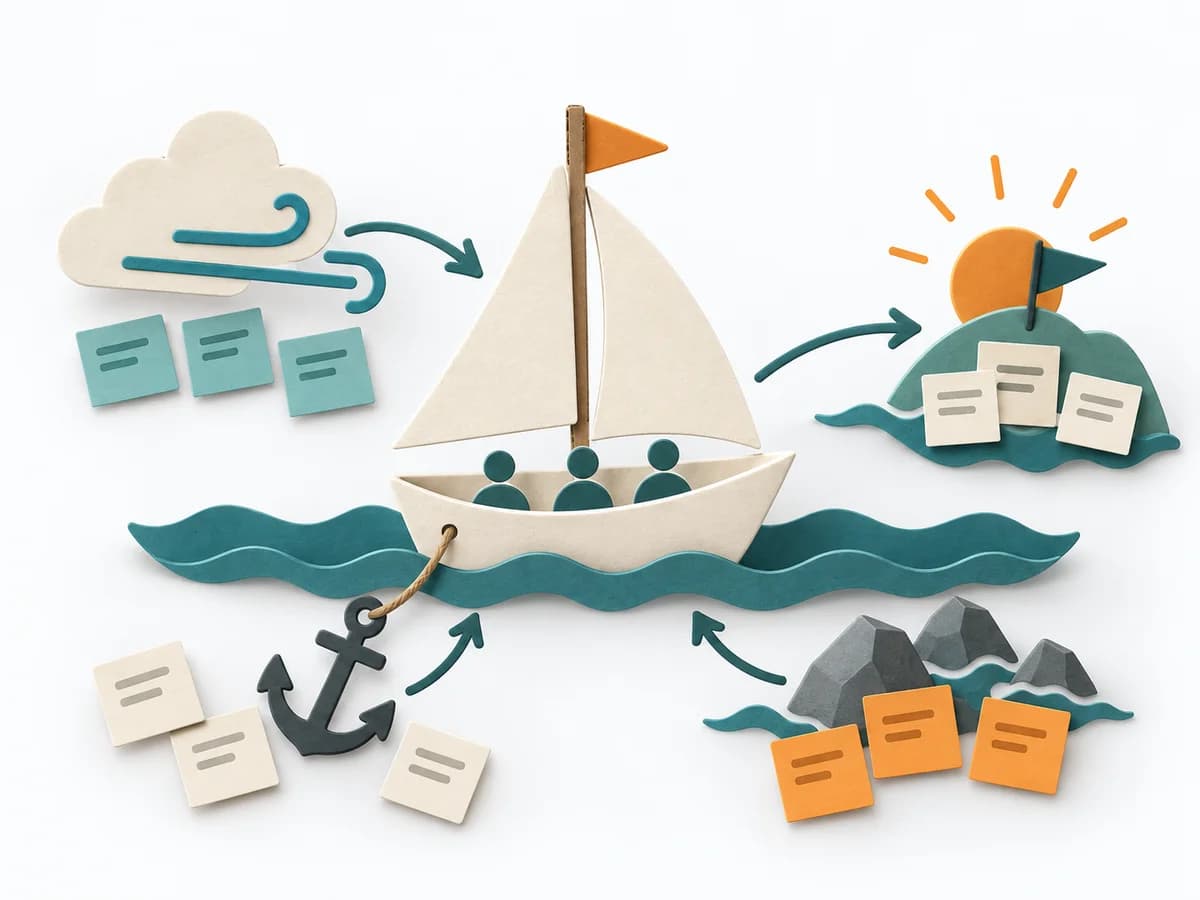 Agile Sailboat Retrospective |
|---|---|---|---|---|
Purposedifferent | When improvement options need to be sorted more finely than just start and stop, it brings observations into clear kinds of action. This makes visible what should be done more, less, newly, or continued. | When a user journey falls apart across many touchpoints, customer journey mapping makes the experience visible as a coherent arc. Phases, emotions, and breaks become legible enough to prioritize critical moments deliberately. | When a sprint should not only be assessed but also learned from, it captures experience in clear learning categories. It records what worked, what's missing, and what should run differently next time. | When a team wants to read momentum, brakes, and risks together, it offers an easily understandable picture of the situation. It makes drive, obstacles, and headwind visible in the same picture. |
Complexitydifferent | Low | Medium | Low | Low |
Timedifferent | 45-90 min | 2-4 h | 45–75 min | 45-90 min |
Participantsdifferent | 4-12 | 4-10 | Team members involved | 4-12 |
Formatsame | Workshop | Workshop | Workshop | Workshop |
Outputdifferent | Starfish Board, Practice Changes, Experiments | Journey Map, Pain-point List, Opportunity Backlog | 4Ls Board, Learning Themes, Improvement Actions | Sailboat Board, Risks, Improvement Actions |
Tagsno overlap | RetrospectiveImprovementExperimentsTeam | JourneyServiceService design | RetrospectiveLearningReflectionTeam | RetrospectiveTeamImprovement |