View methods side by side.
Choose up to four methods. Add them using the search and share the comparison by copying its link.
| Criterion |  UX Design Service Blueprinting | 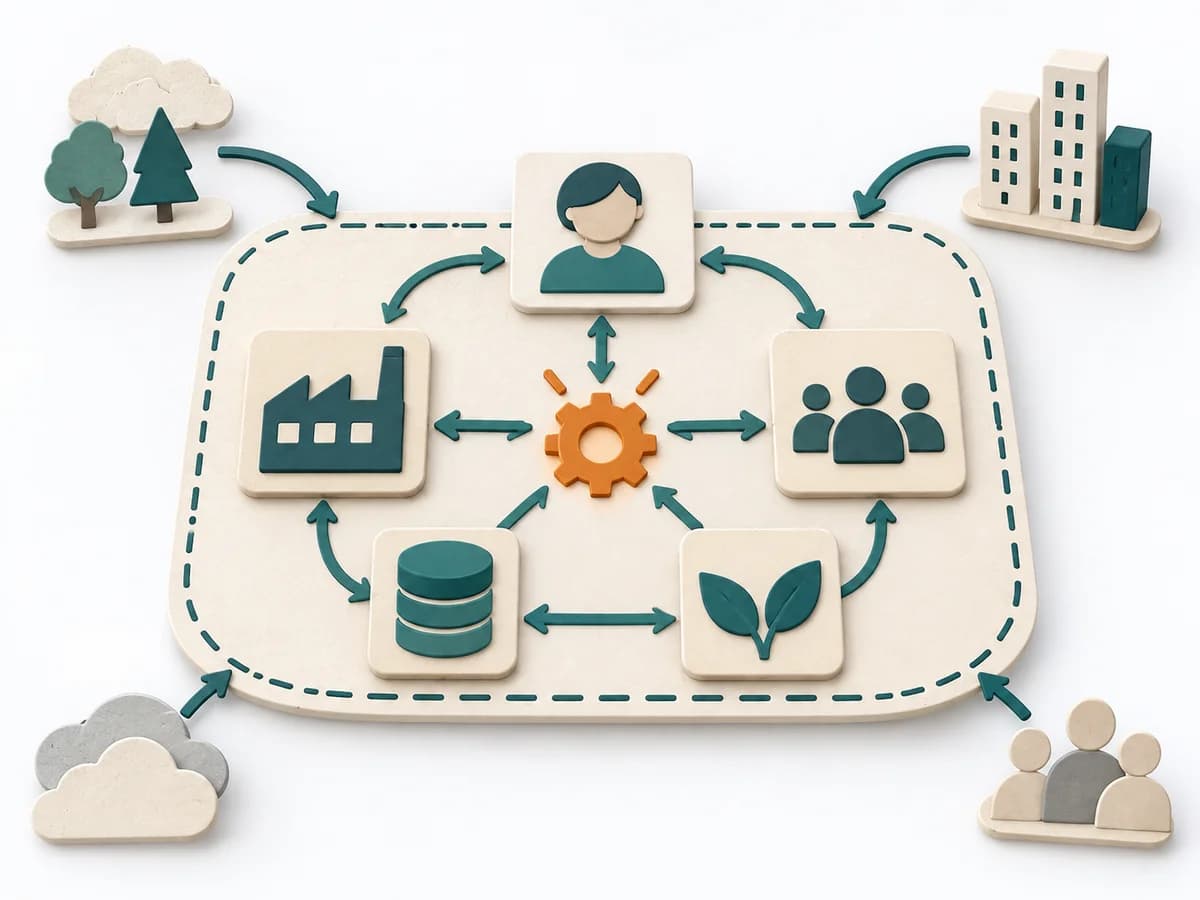 Systems Thinking Systems Mapping | 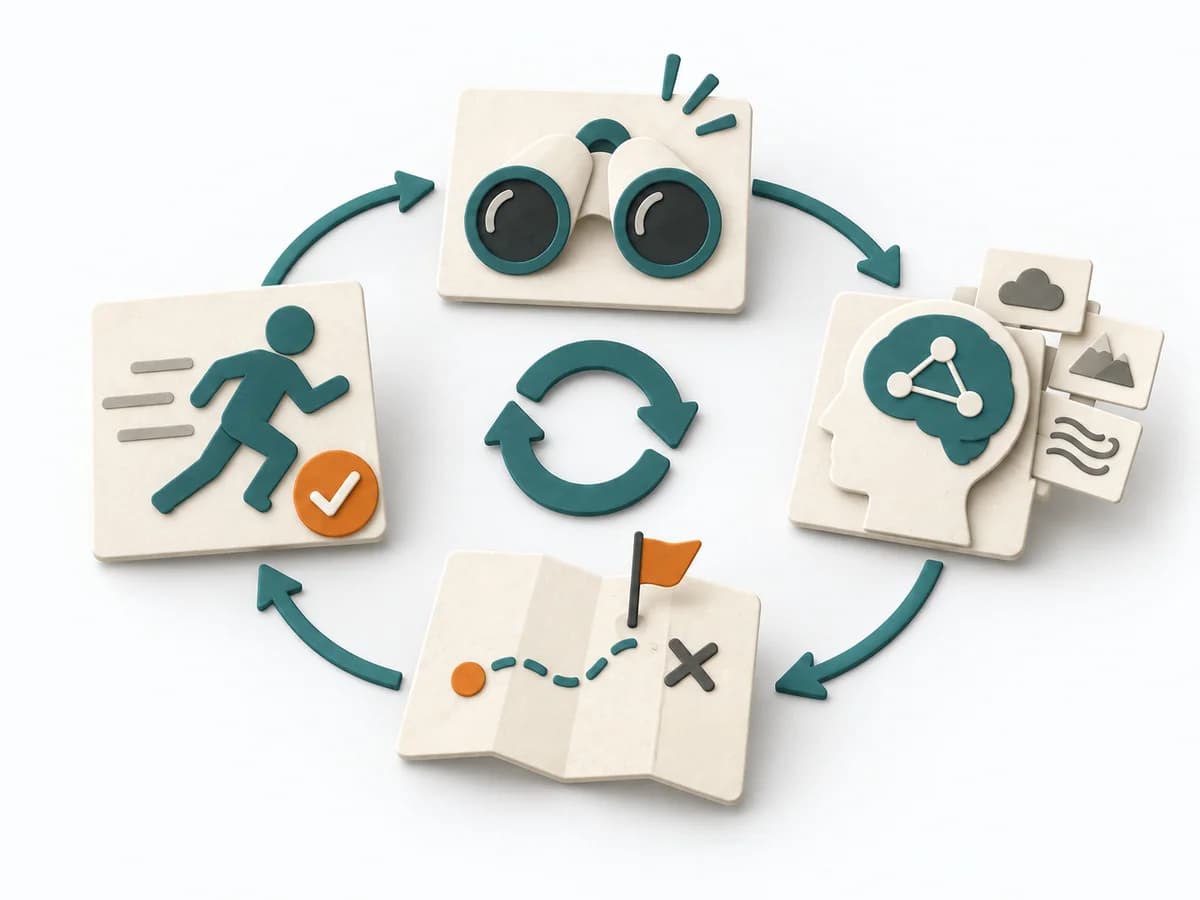 Decision Making OODA Loop | 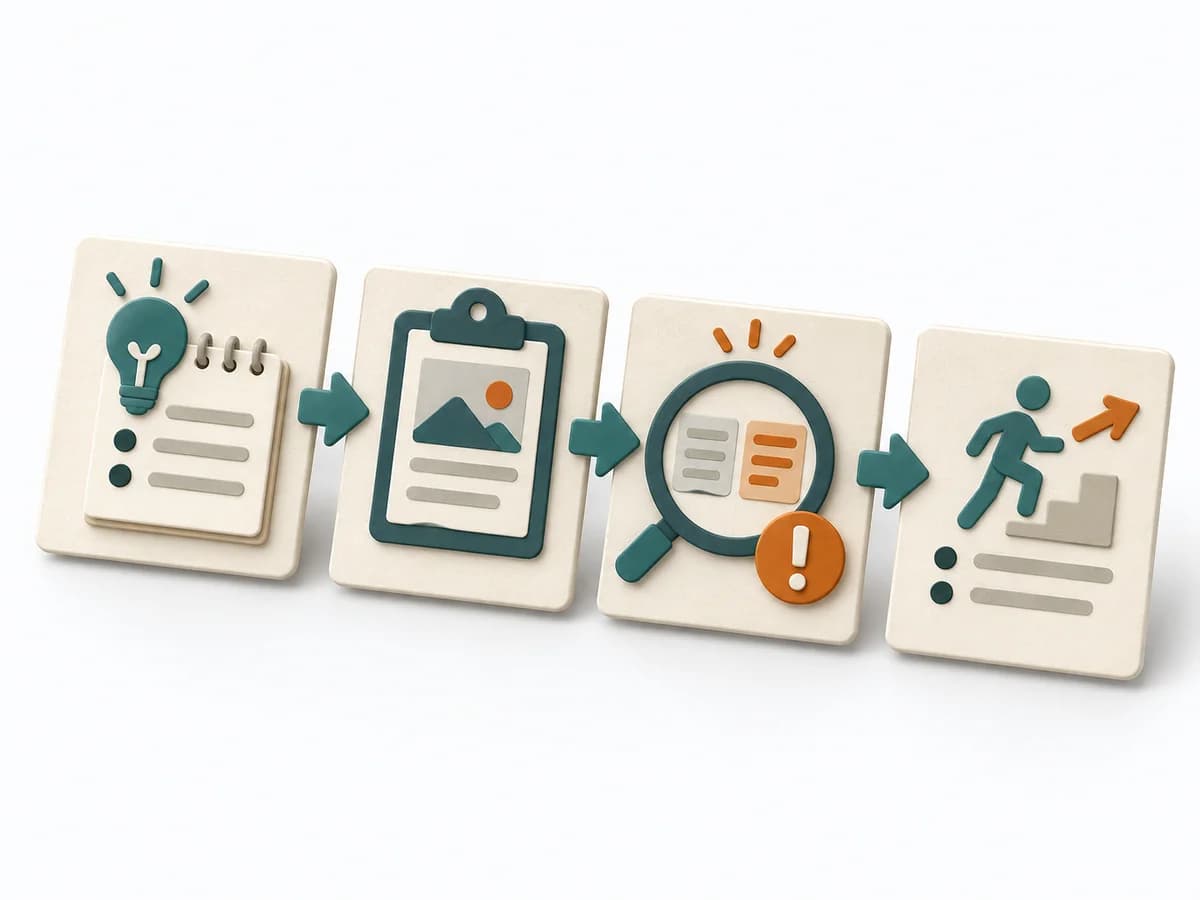 Operations After-Action Review |
|---|---|---|---|---|
Purposedifferent | When a service experience is spread across several touchpoints, it brings frontstage and backstage together. It shows where user contact and internal responsibility must fit. | Systems Mapping arranges elements, relationships, and boundaries so a complex field becomes legible at a glance. The overview stabilizes the overall picture before detail work or steering begins. | In dynamic situations, decisions become outdated faster than they can be prepared. The OODA Loop holds observing, orienting, deciding, and acting together as a recurring rhythm so reaction does not slide into inertia. | After missions or project phases with unclear outcomes, the method makes visible what actually happened and what can be learned from it. It separates course, effect, and causes so experience turns into solid improvement. |
Complexitydifferent | High | Medium | Medium | Low |
Timedifferent | 0.5-2 Tage | 1-3 h | 15-60 min je Zyklus | 20-45 min |
Participantsdifferent | 6-12 | 3-12 | 1-8 | 3-12 |
Formatdifferent | Workshop | Workshop + async | Workshop + async | Workshop + async |
Outputdifferent | Service Blueprint, Fail Points, Ownership Map | System Map, Dependencies, Leverage Points | Situation Assessment, Decision Loop, Action Updates | Lessons learned, Action items, Event summary |
Tagsno overlap | Service designOperationsJourneyBlueprint | Systems thinkingMappingBoundariesChange | DecisionChangeLearningStrategy | LearningOperationsImprovement |