View methods side by side.
Choose up to four methods. Add them using the search and share the comparison by copying its link.
| Criterion |  UX Design Service Blueprinting |  Facilitation Expectation Mapping | 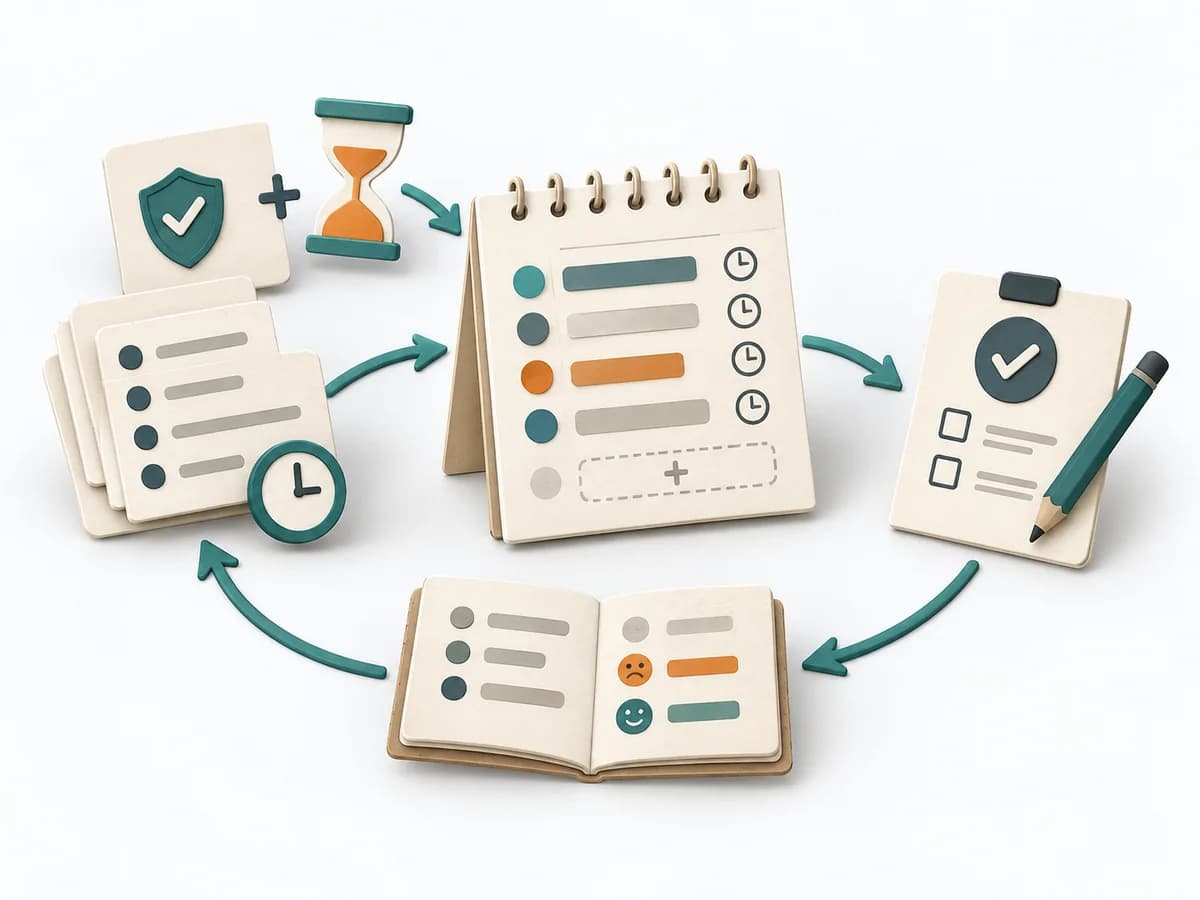 Operations ALPEN Method |  Facilitation Power Interest Grid |
|---|---|---|---|---|
Purposedifferent | When a service experience is spread across several touchpoints, it brings frontstage and backstage together. It shows where user contact and internal responsibility must fit. | When roles, interfaces, or projects fail because of differing expectations, Expectation Mapping surfaces these differences. It shows what each side takes for granted and where the pictures diverge. | With an overloaded day full of too many tasks, a realistic picture of the day emerges. The method connects estimating, deciding, and buffer thinking so planning fits available energy and time. | When many stakeholders compete for attention at once, the Power Interest Grid sorts them by influence and stake. It turns individual contributions into a visible selection. The result is captured as a Power Interest Grid and a stakeholder-specific strategy. |
Complexitydifferent | High | Low | Low | Low |
Timedifferent | 0.5-2 Tage | 45-90 min | 10-20 min daily | 30-60 min |
Participantsdifferent | 6-12 | 3-12 | 1 | 2-8 |
Formatdifferent | Workshop | Workshop | Async | Workshop |
Outputdifferent | Service Blueprint, Fail Points, Ownership Map | Expectation Map, Alignment Notes, Agreements | Daily Plan, Time Estimates, Review Notes | Power Interest Grid, Strategy per Stakeholder |
Tagsno overlap | Service designOperationsJourneyBlueprint | AlignmentStakeholdersTeam | PlanningTime managementProductivityOperations | StakeholdersFacilitationAlignmentPlanning |