View methods side by side.
Choose up to four methods. Add them using the search and share the comparison by copying its link.
| Criterion |  UX Design Service Blueprinting |  UX Design Customer Journey Canvas | 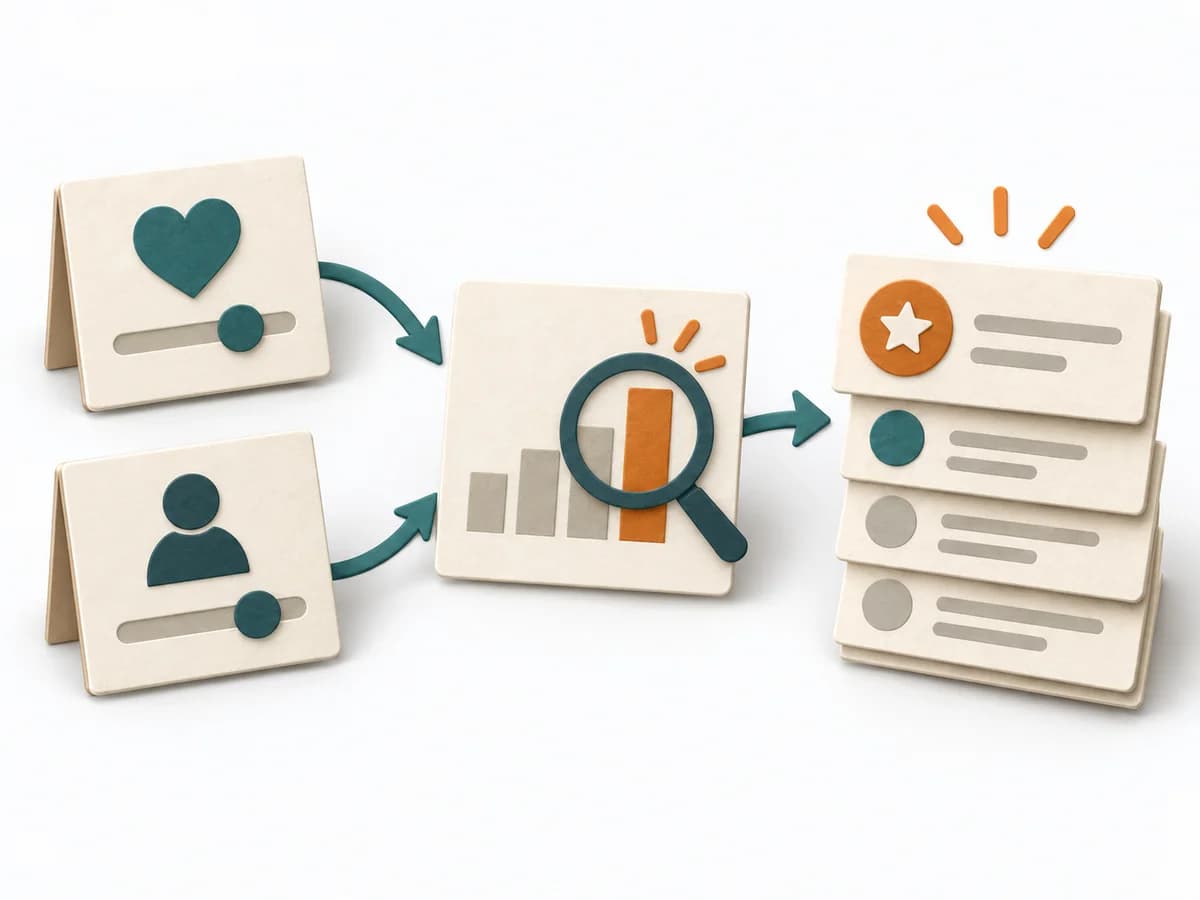 Product Discovery Opportunity Scoring |  Operations ABC Analysis |
|---|---|---|---|---|
Purposedifferent | When a service experience is spread across several touchpoints, it brings frontstage and backstage together. It shows where user contact and internal responsibility must fit. | When a journey needs to be understood across several phases, it arranges experience, touchpoints, and opportunities into one picture. It makes gaps and friction along the user path clear. | When opportunities need ranking by their effect, it makes importance and satisfaction directly comparable. It separates problem, assumption, solution, and evidence. The result is captured as an opportunity-score table and top outcomes. | With many similar objects of differing economic significance, the method prioritizes effort by effect. It separates what needs regular steering from what rarely needs attention. |
Complexitydifferent | High | Medium | Medium | Low |
Timedifferent | 0.5-2 Tage | 1-3 h | 60-120 min | 30-60 min |
Participantsdifferent | 6-12 | 3-10 | 3-6 | 1-5 |
Formatdifferent | Workshop | Workshop | Workshop + async | Async |
Outputdifferent | Service Blueprint, Fail Points, Ownership Map | Customer Journey Canvas, Pain Points, Experience Opportunities | Opportunity Score Table, Top Outcomes | ABC Classification, Focus Rules, Control List |
Tagsno overlap | Service designOperationsJourneyBlueprint | JourneyCustomerService designCanvas | PrioritizationDiscoveryOutcomesNeeds | PrioritizationOperationsPortfolio |