View methods side by side.
Choose up to four methods. Add them using the search and share the comparison by copying its link.
Selected:Scatter DiagramFailure Mode and Effects AnalysisCurrent Reality TreeTheory of Constraints Thinking Process
| Criterion |  Operations Scatter Diagram |  Operations Failure Mode and Effects Analysis |  Systems Thinking Current Reality Tree | 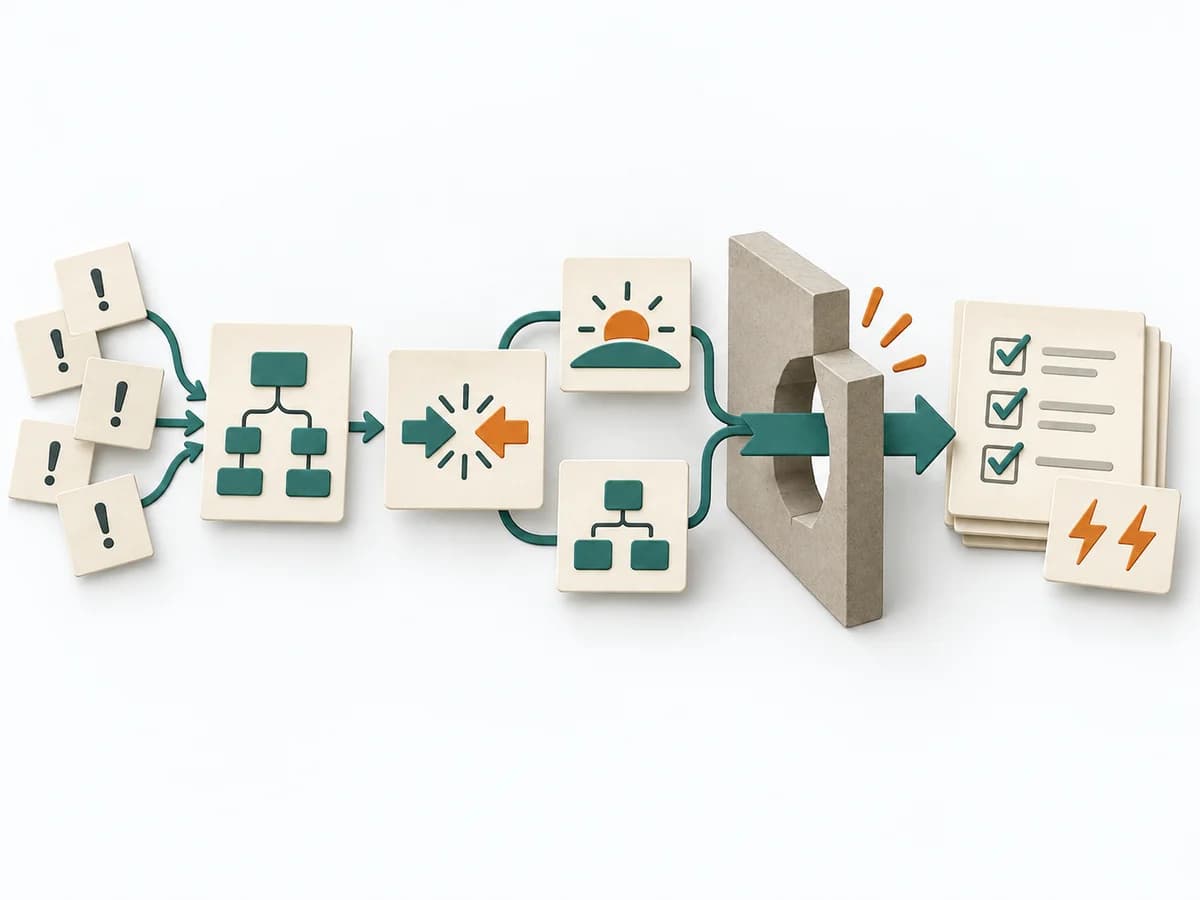 Systems Thinking Theory of Constraints Thinking Process |
|---|---|---|---|---|
Purposedifferent | When the question is whether two measures are related, the method makes patterns in the data picture visible. It separates felt correlations from relationships that actually show up in the data. | For a process, product, or service with noticeable failure risks, the method assesses possible failure modes in advance. It directs attention to combinations of occurrence, effect, and detectability. | A Current Reality Tree condenses many symptoms into a few causal chains. The method makes visible which core problems drive several negative effects at once. | The Theory of Constraints Thinking Process exposes a system's bottleneck and the logic behind it. It suits situations where many symptoms trace back to the same limiting relationship. |
Complexitydifferent | Low | High | High | High |
Timedifferent | 30-90 min | 2-6 h | 2-6 h | 0.5-3 Tage |
Participantsdifferent | 1-4 | 3-10 | 3-8 | 4-10 |
Formatdifferent | Workshop + async | Workshop | Workshop | Workshop |
Outputdifferent | Scatter Plot, Korrelationsnotiz, Hypothesenliste | FMEA Table, Risk Priority, Mitigation Actions | Current Reality Tree, Core Problems, Intervention Ideas | Current Reality Logic, Conflict Cloud, Future Reality Tree, Implementation Obstacles |
Tagsno overlap | Root causeQualityVisualization | RiskQualityOperationsRoot cause | Systems thinkingRoot causeConstraintsCausality | Theory of ConstraintsConstraintsSystems thinkingCausality |