View methods side by side.
Choose up to four methods. Add them using the search and share the comparison by copying its link.
| Criterion |  Operations Scatter Diagram | 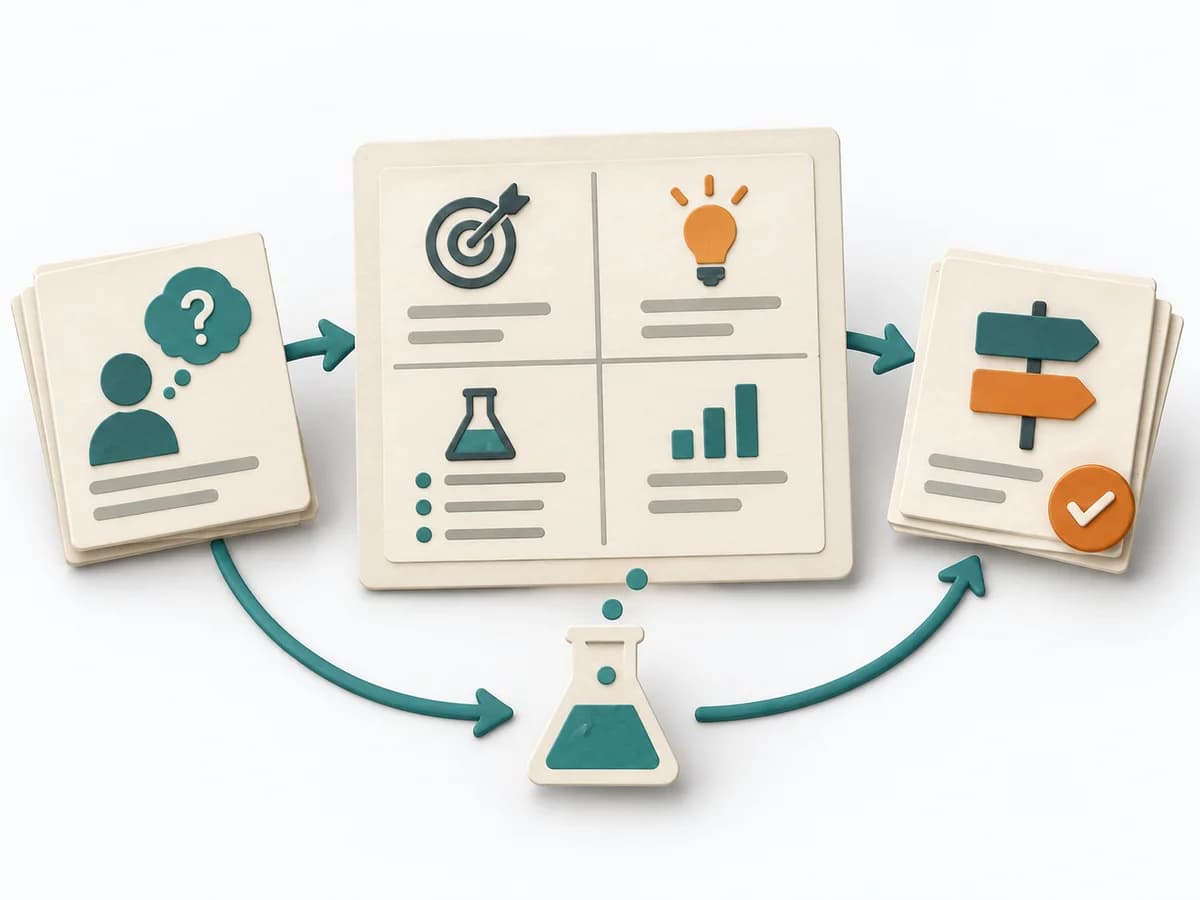 Product Discovery Experiment Canvas | 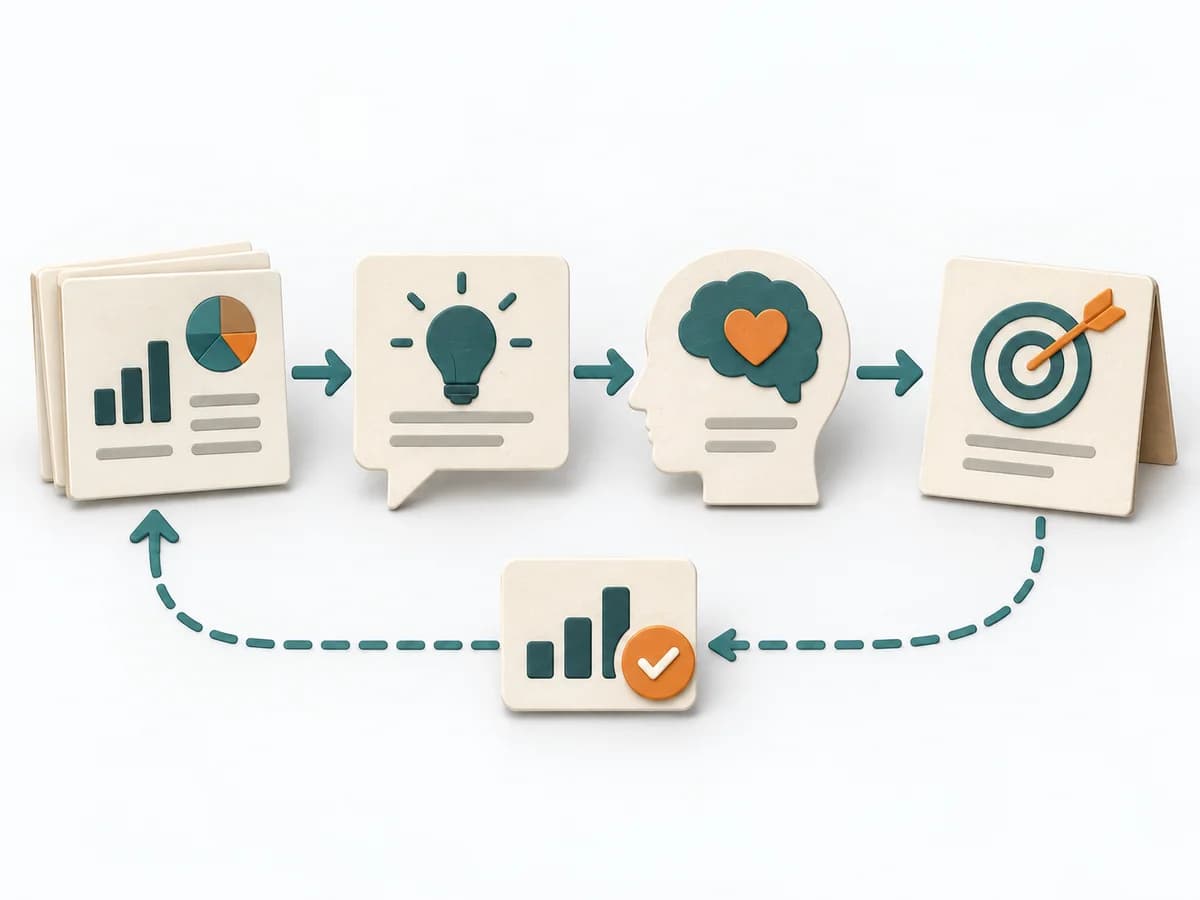 Product Strategy DIBB |  Product Discovery Assumption Mapping |
|---|---|---|---|---|
Purposedifferent | When the question is whether two measures are related, the method makes patterns in the data picture visible. It separates felt correlations from relationships that actually show up in the data. | When experiments become unreadable after the fact, it arranges hypothesis, signal, and learning goal on a single canvas. It separates problem, assumption, solution, and evidence. The result is captured as a Completed Experiment Canvas and a Success Metric. | DIBB helps clarify target groups, value, goals, and priorities by making the logic behind a decision explicit. It captures results as a DIBB document, belief list, bet list, and learning report. | When assumptions still sit unordered in the room, it weighs uncertainty against leverage. It makes visible which hypotheses should be checked first. |
Complexitydifferent | Low | Low | Low | Medium |
Timedifferent | 30-90 min | 30-60 min | 1-2 h | 45-60 min |
Participantsdifferent | 1-4 | 1-5 | 2-8 | 2-8 |
Formatsame | Workshop + async | Workshop + async | Workshop + async | Workshop + async |
Outputdifferent | Scatter Plot, Korrelationsnotiz, Hypothesenliste | Completed Experiment Canvas, Success Metric | DIBB document, Belief list, Bet list, Learning report | Assumption map, Test backlog, Risk ranking |
Tagsno overlap | Root causeQualityVisualization | ExperimentsValidationDiscoveryHypothesis | StrategyDecisionAssumptionsHypothesis | AssumptionsRiskExperimentsValidation |