View methods side by side.
Choose up to four methods. Add them using the search and share the comparison by copying its link.
| Criterion |  Operations Scatter Diagram | 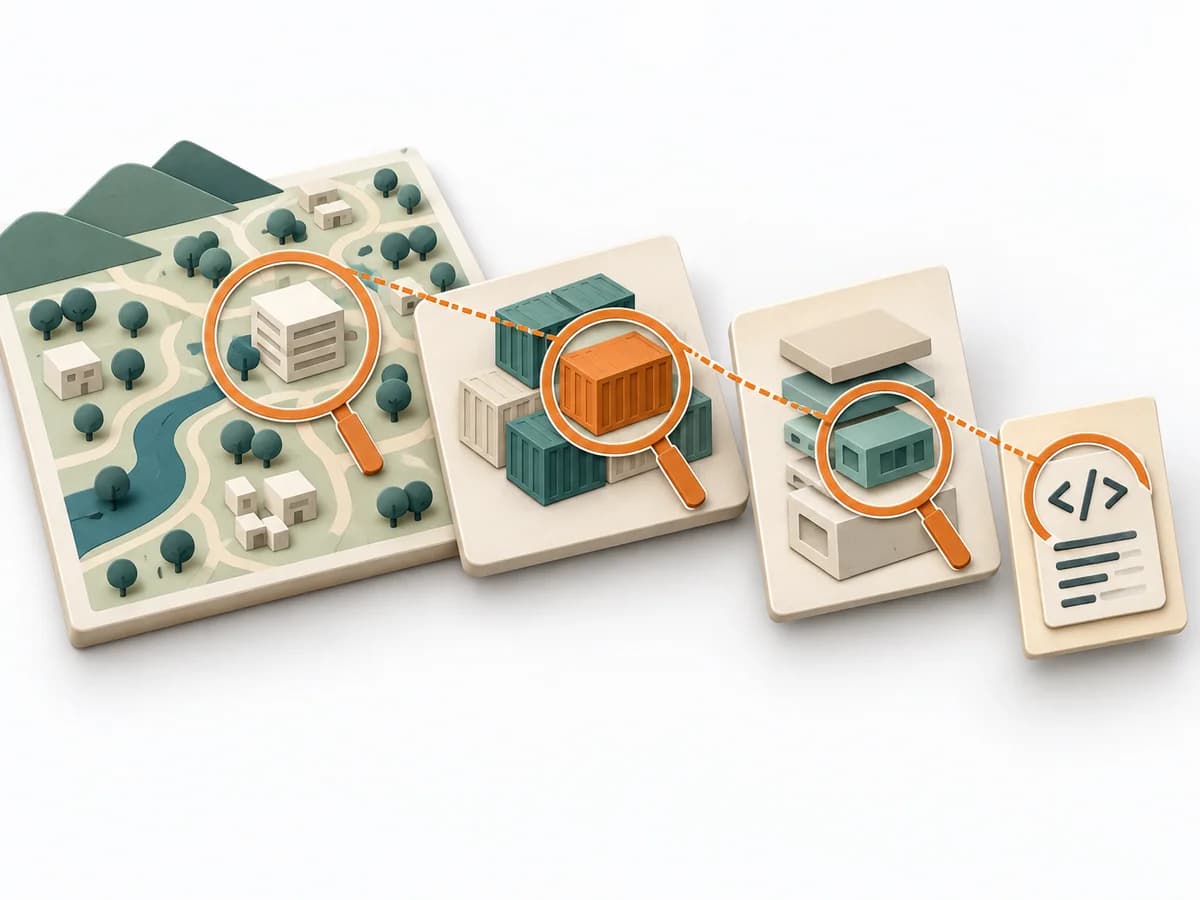 Architecture C4 Model |  Operations Change Analysis |  Architecture Architecture Communication Canvas |
|---|---|---|---|---|
Purposedifferent | When the question is whether two measures are related, the method makes patterns in the data picture visible. It separates felt correlations from relationships that actually show up in the data. | The C4 Model makes a system legible across several resolution levels, from context down to code. It suits situations where different audiences need to understand the same architecture from different altitudes. | For a deviation after a change, the method isolates the influence of the altered condition. It narrows down which differences are relevant and which are just accompanying noise. | The Architecture Communication Canvas plans architecture communication so the right people receive the right message. The method turns technical complexity into deliberate communication design. |
Complexitydifferent | Low | Low | Medium | Medium |
Timedifferent | 30-90 min | 1-4 h | 45-120 min | 60-120 min |
Participantsdifferent | 1-4 | 1-5 | 2-6 | 2-8 |
Formatsame | Workshop + async | Workshop + async | Workshop + async | Workshop + async |
Outputdifferent | Scatter Plot, Korrelationsnotiz, Hypothesenliste | Context Diagram, Container Diagram, Component Diagram | Change Matrix, Cause Hypotheses, Validation Questions, Action List | Communication Canvas, Stakeholder Messages, Architecture Communication Plan |
Tagsno overlap | Root causeQualityVisualization | ArchitectureCommunicationVisualization | ChangeRoot causeTroubleshootingComparison | ArchitectureCommunicationStakeholdersCanvas |