View methods side by side.
Choose up to four methods. Add them using the search and share the comparison by copying its link.
| Criterion | 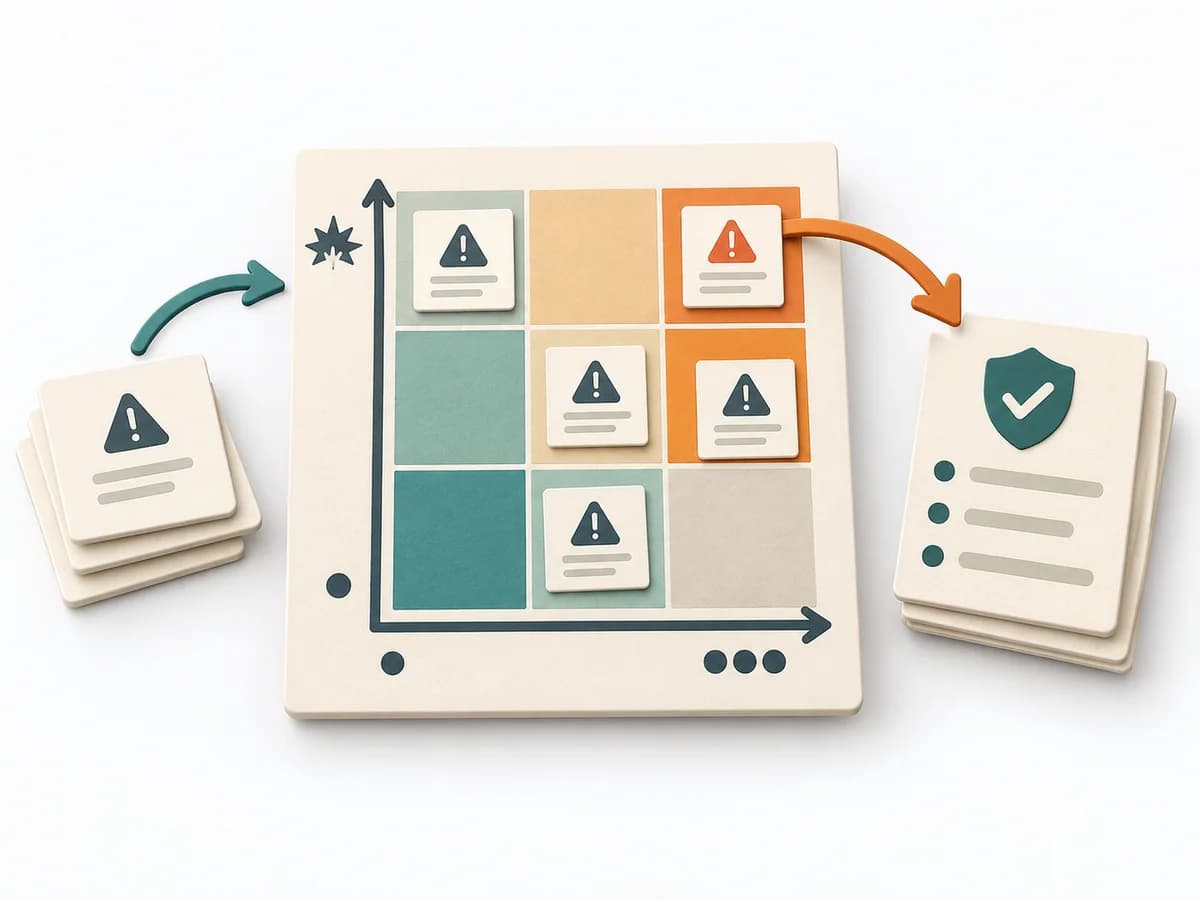 Decision Making Risk Matrix |  Product Discovery Kano Model | 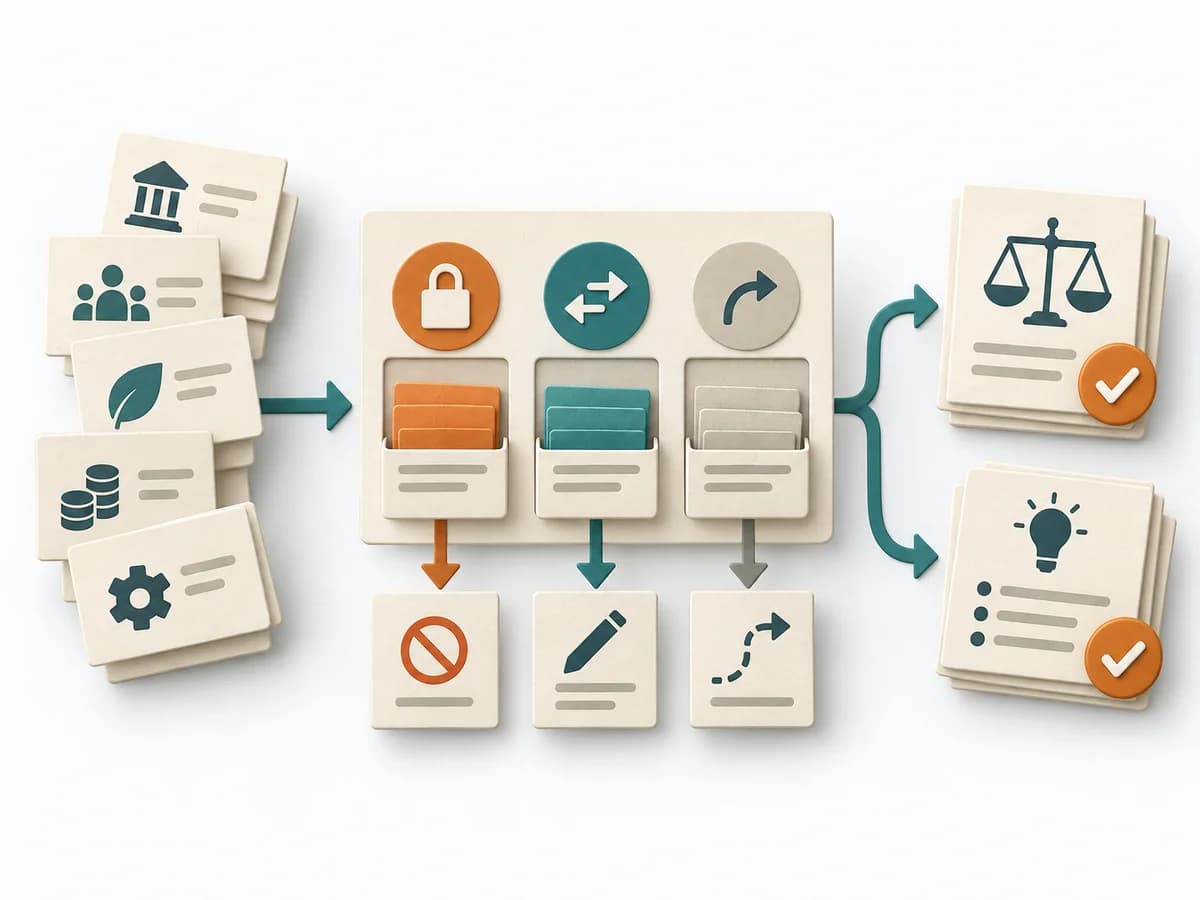 Decision Making Constraint Analysis | 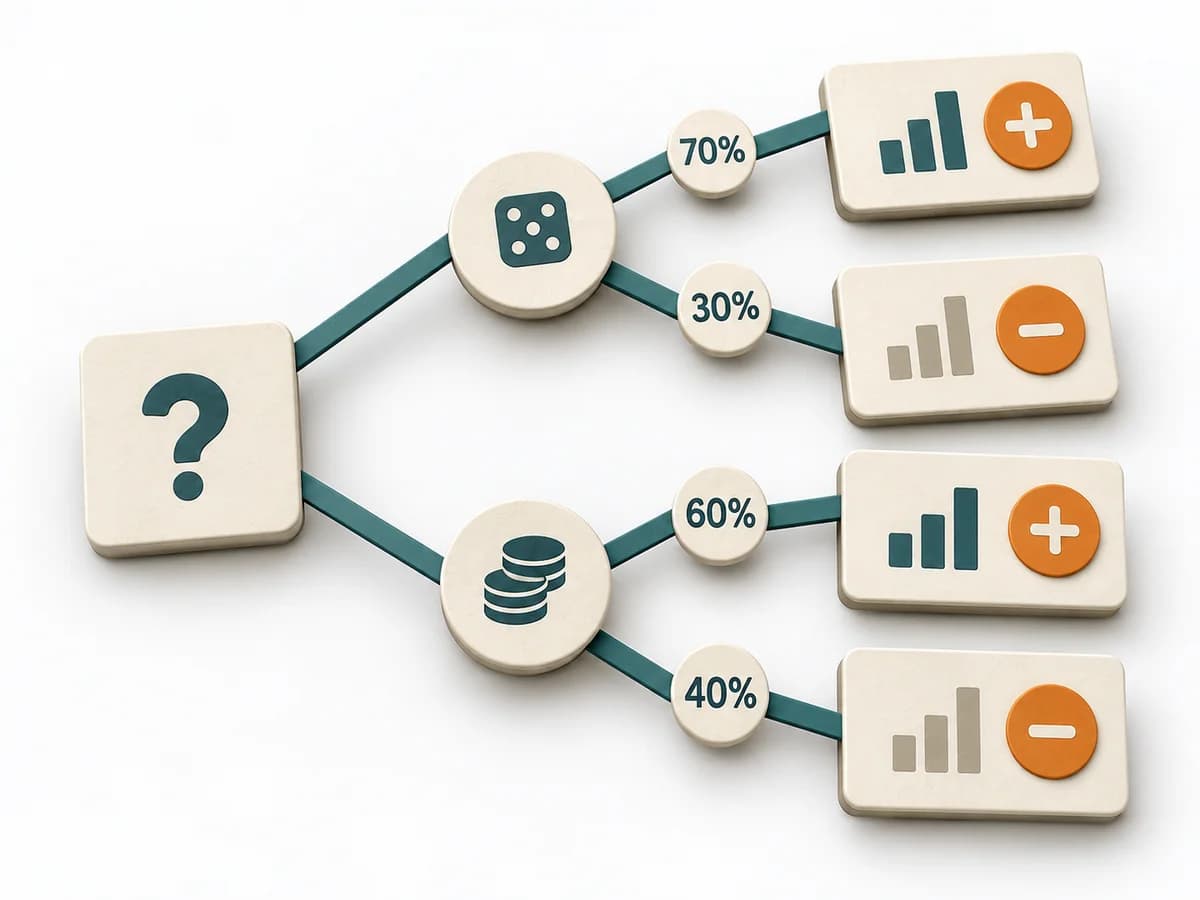 Decision Making Decision Tree |
|---|---|---|---|---|
Purposedifferent | When a project faces many possible disruptions, it quickly becomes unclear which risks deserve attention first. It separates options, evaluation criteria, and open risks. The result is captured as a Risk Matrix and a Top Risk List. | When features need to be distinguished by their effect on satisfaction, it makes expectations and surprises comparable. It separates basic needs, performance contribution, and delight. | When an initiative stalls, the limit often lies not in the idea but in hard or soft boundary conditions. Constraint Analysis separates these limits and shows which of them can actually be shaped. | For decisions with follow-on paths and dependencies, a linear comparison is often not enough. A Decision Tree shows how options branch under conditions and which consequences hang on each branch. |
Complexitydifferent | Low | Medium | Low | Medium |
Timedifferent | 30-60 min | 1-2 Tage | 30-90 min | 30-90 min |
Participantsdifferent | 3-10 | 10-50 | 2-8 | 1-6 |
Formatsame | Workshop + async | Workshop + async | Workshop + async | Workshop + async |
Outputdifferent | Risk Matrix, Top Risk List | Kano Matrix, Feature Classes, Priority Themes | Constraint List, Hard/Soft Classification, Option Impact Notes, Decision Boundaries | Decision Tree, Option Map, Assumption List |
Tagsno overlap | RiskDecisionPrioritizationAssessment | SatisfactionPrioritizationCustomer | ConstraintsDecisionPlanningOptions | DecisionTreeOptions |