View methods side by side.
Choose up to four methods. Add them using the search and share the comparison by copying its link.
| Criterion |  Product Strategy RICE Scoring | 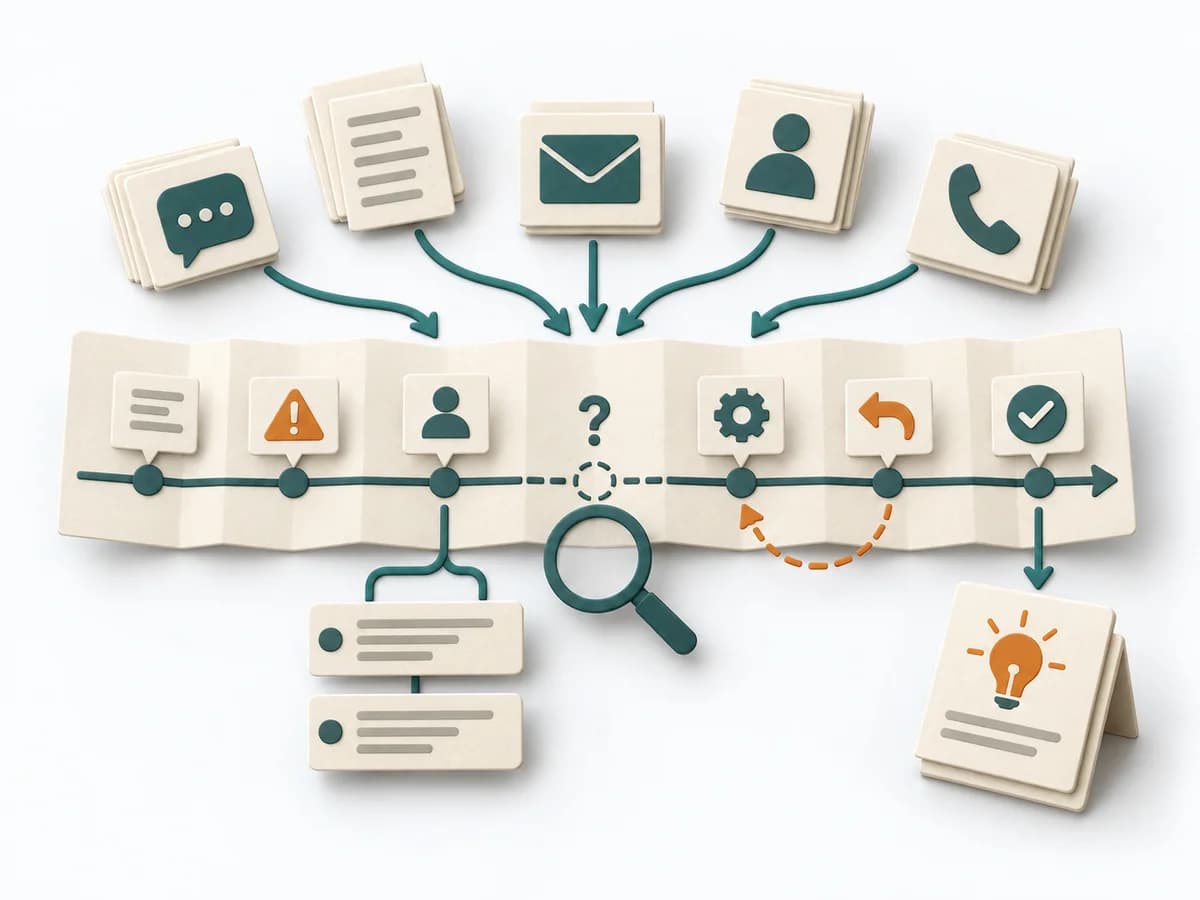 DevOps Incident Timeline Analysis | 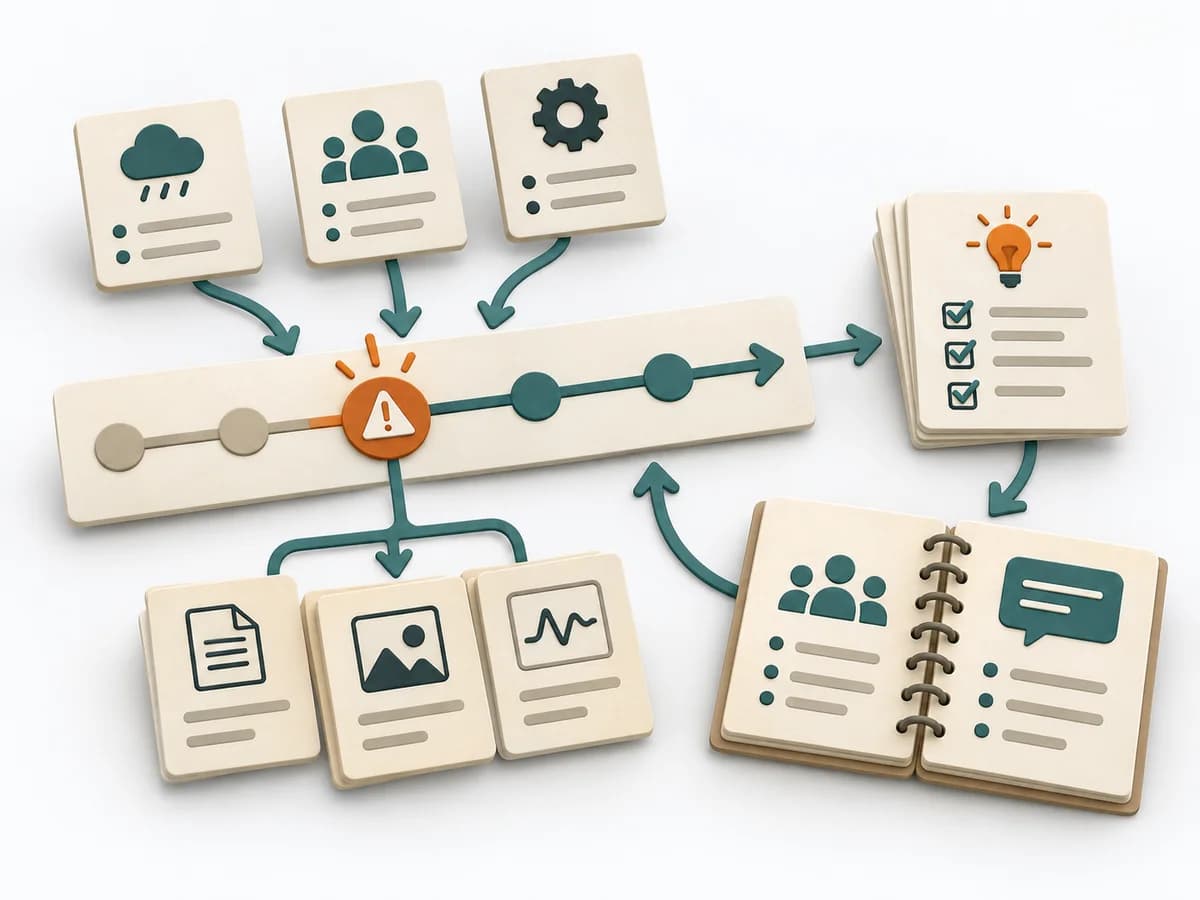 DevOps Blameless Postmortem | 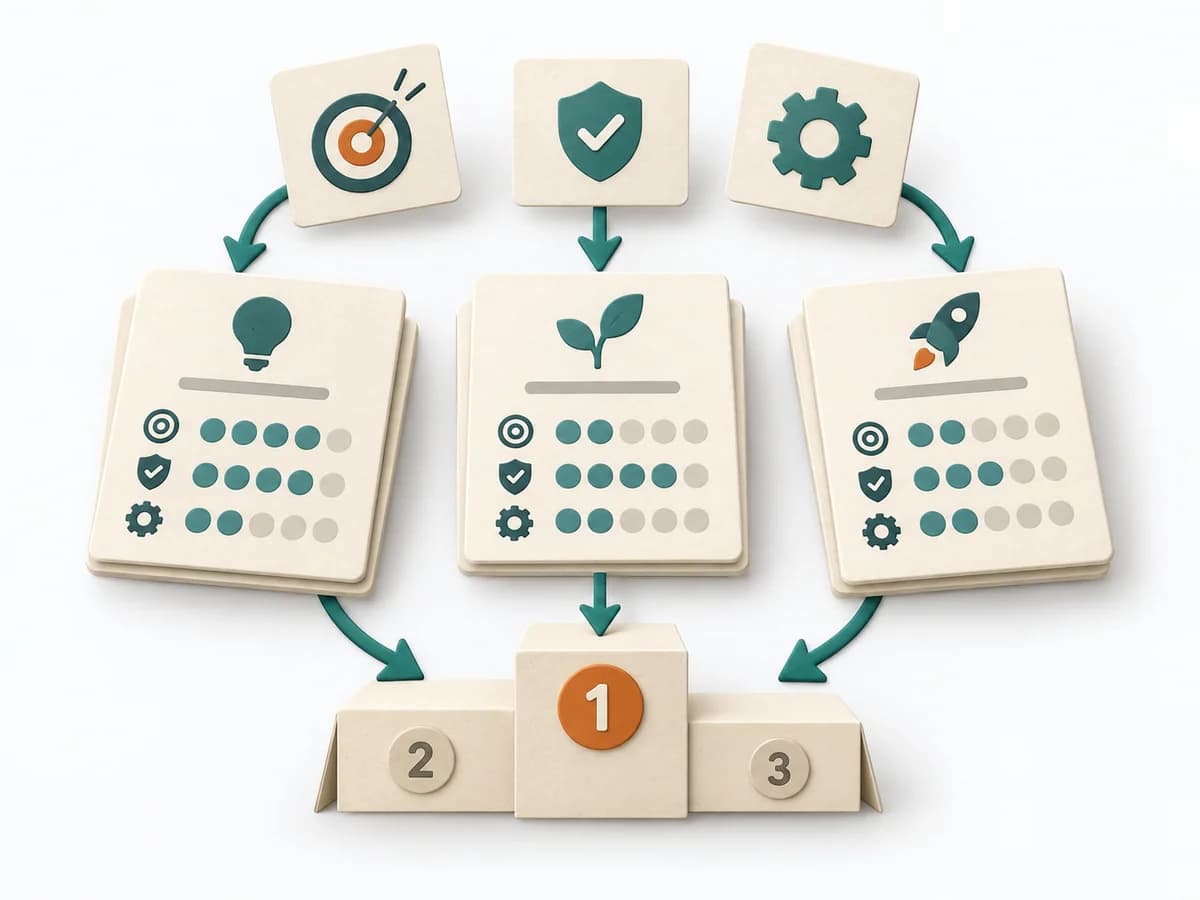 Product Strategy ICE Scoring |
|---|---|---|---|---|
Purposedifferent | When many initiatives compete for the same resources, it brings reach, impact, confidence, and effort into one shared ranking. It makes prioritization economically connectable. | For an incident with an unclear sequence, the method makes the timeline precisely visible. It separates perception, reaction, and delay so cause and effect become more clearly readable. | After an incident with damage or a near miss, the method creates a sober field for learning without assigning blame. It directs attention to the course of events, conditions, and effective countermeasures. | When ideas need sorting quickly, it condenses impact, confidence, and effort into one compact score. It connects customer value, product logic, and decision priorities. The result is captured as an ICE table and top-ideas list. |
Complexitydifferent | Medium | Medium | Medium | Low |
Timedifferent | 60-90 min | 60-180 min | 30-90 min | 30-60 min |
Participantsdifferent | 2-10 | 3-10 | 3-12 | 2-8 |
Formatsame | Workshop + async | Workshop + async | Workshop + async | Workshop + async |
Outputdifferent | RICE Scores, Ranked List, Assumption Log | Incident Timeline, Evidence Log, Delay Analysis, Improvement Actions | Postmortem Doc, Action Items, Timeline | ICE Table, Top Idea List |
Tagsno overlap | PrioritizationScoringRoadmapTradeoffs | IncidentTimelineSite Reliability Engineering | Site Reliability EngineeringIncidentLearningReliability | PrioritizationScoringGrowthDecision |