View methods side by side.
Choose up to four methods. Add them using the search and share the comparison by copying its link.
| Criterion | 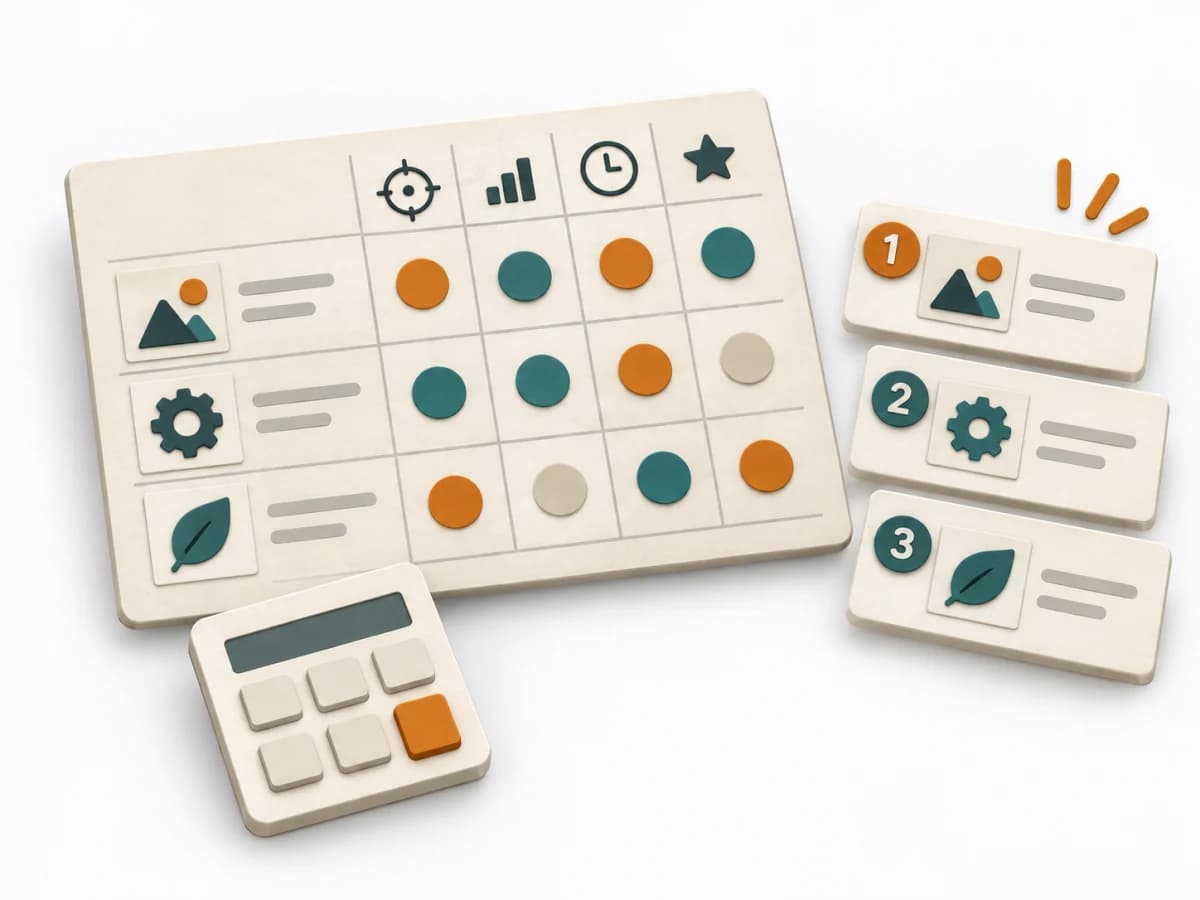 Product Strategy RICE Scoring | 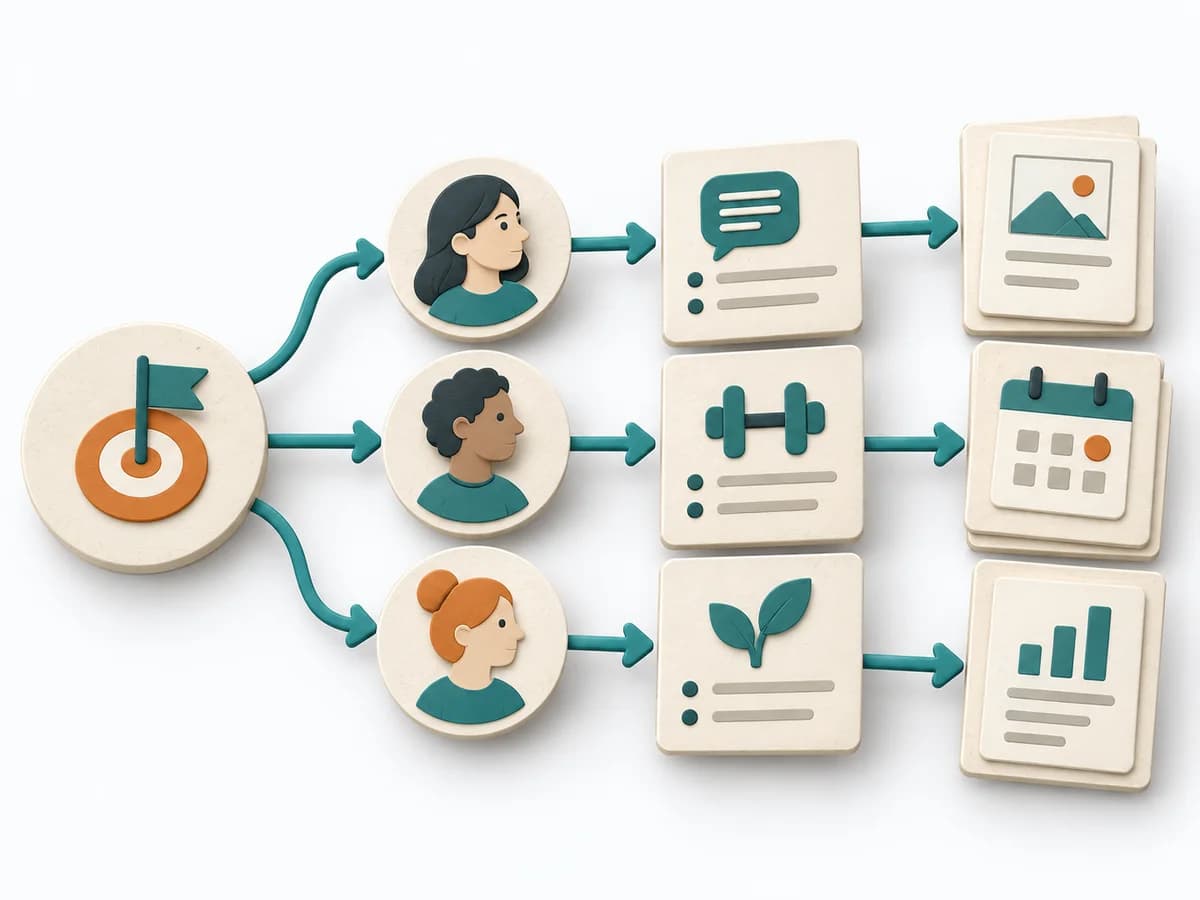 Product Strategy Impact Mapping | 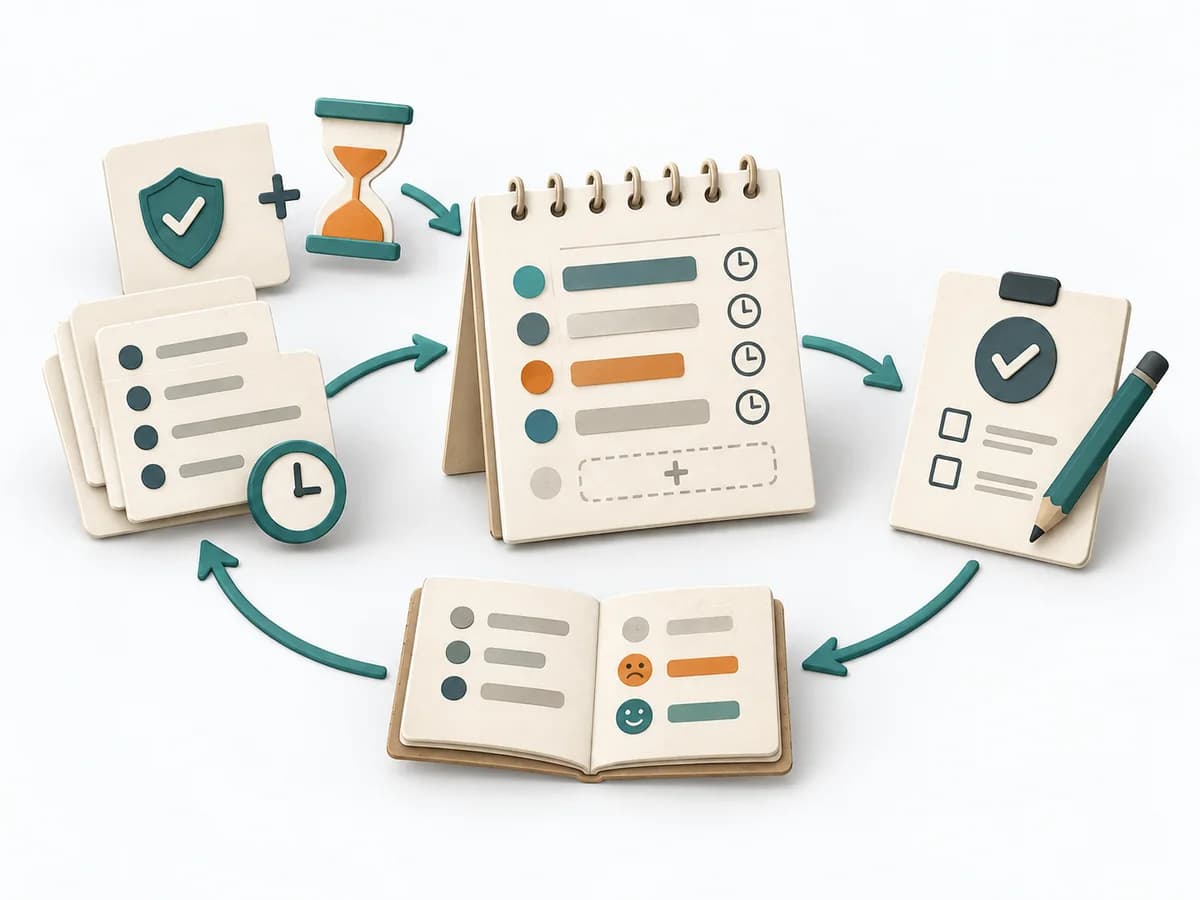 Operations ALPEN Method | 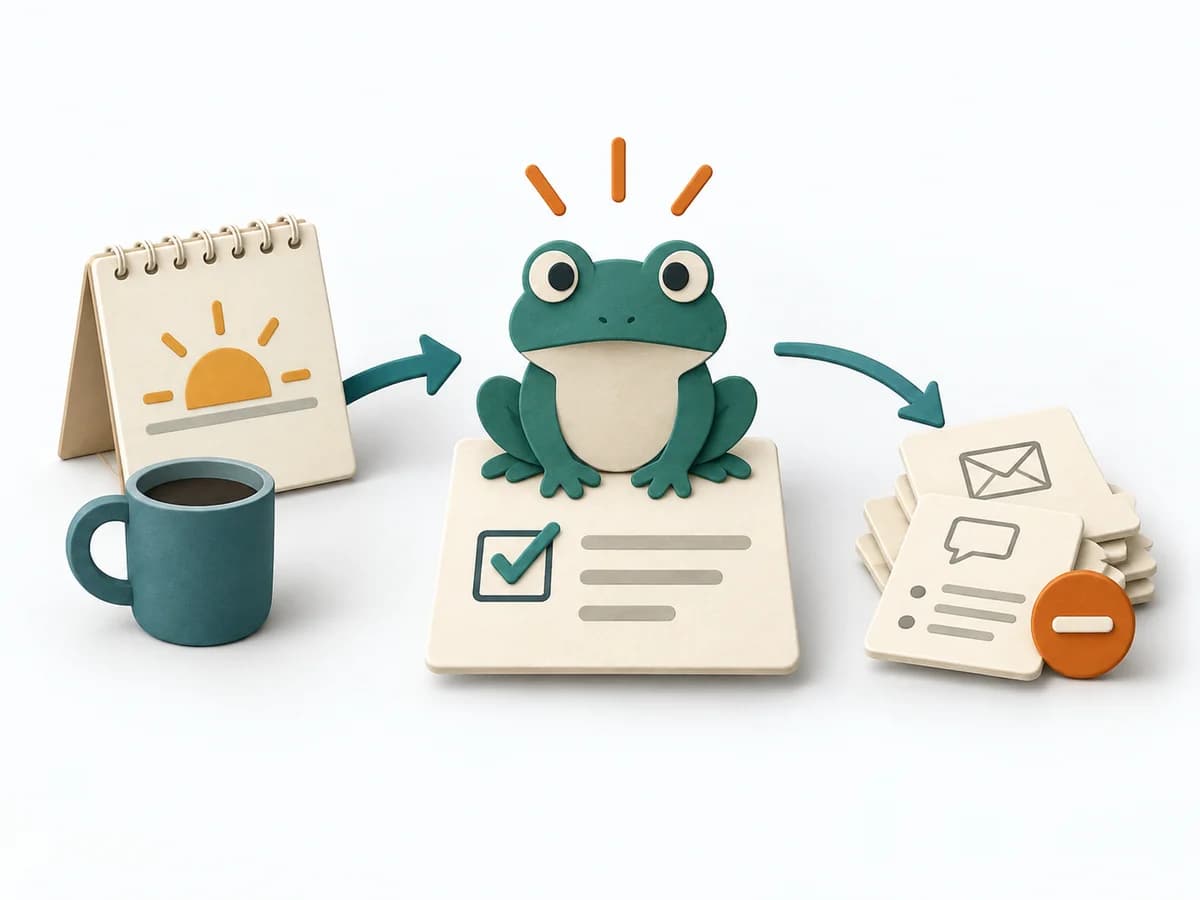 Operations Eat the Frog |
|---|---|---|---|---|
Purposedifferent | When many initiatives compete for the same resources, it brings reach, impact, confidence, and effort into one shared ranking. It makes prioritization economically connectable. | When a goal needs to be connected to several possible paths, it shows chains of impact instead of feature lists. It connects business goal, behavior change, and measures. | With an overloaded day full of too many tasks, a realistic picture of the day emerges. The method connects estimating, deciding, and buffer thinking so planning fits available energy and time. | The method protects energy and attention for the task that creates the largest progress and is often postponed. |
Complexitydifferent | Medium | Medium | Low | Low |
Timedifferent | 60-90 min | 45-90 min | 10-20 min daily | 15-90 min daily |
Participantsdifferent | 2-10 | 3-8 | 1 | 1 |
Formatdifferent | Workshop + async | Workshop | Async | Async |
Outputdifferent | RICE Scores, Ranked List, Assumption Log | Impact Map, Outcome Hypotheses, Delivery Options | Daily Plan, Time Estimates, Review Notes | Priority Task, Completion Note, Daily Focus |
Tagsno overlap | PrioritizationScoringRoadmapTradeoffs | OutcomesStrategyBehaviorPlanning | PlanningTime managementProductivityOperations | PrioritizationProductivityFocusExecution |