View methods side by side.
Choose up to four methods. Add them using the search and share the comparison by copying its link.
| Criterion | 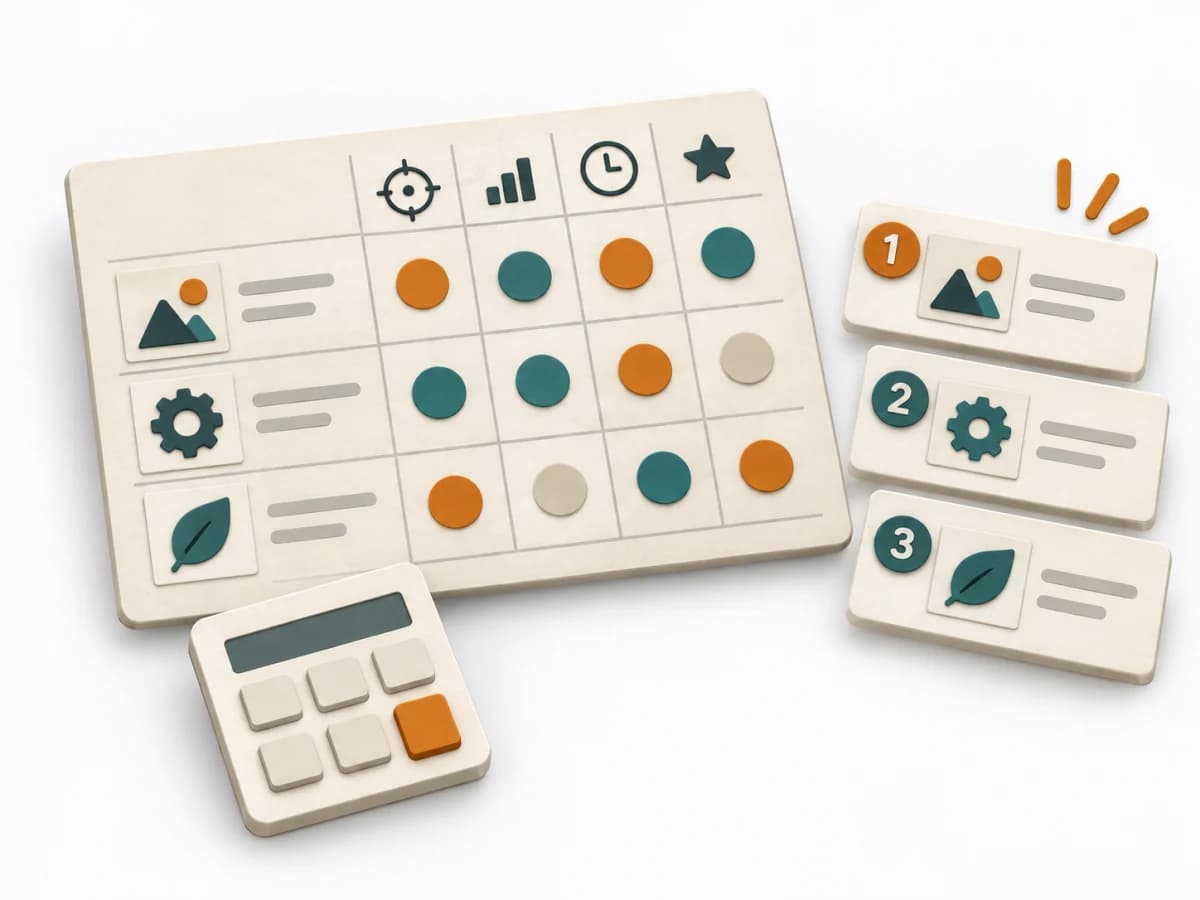 Product Strategy RICE Scoring |  Systems Thinking Evaporating Cloud | 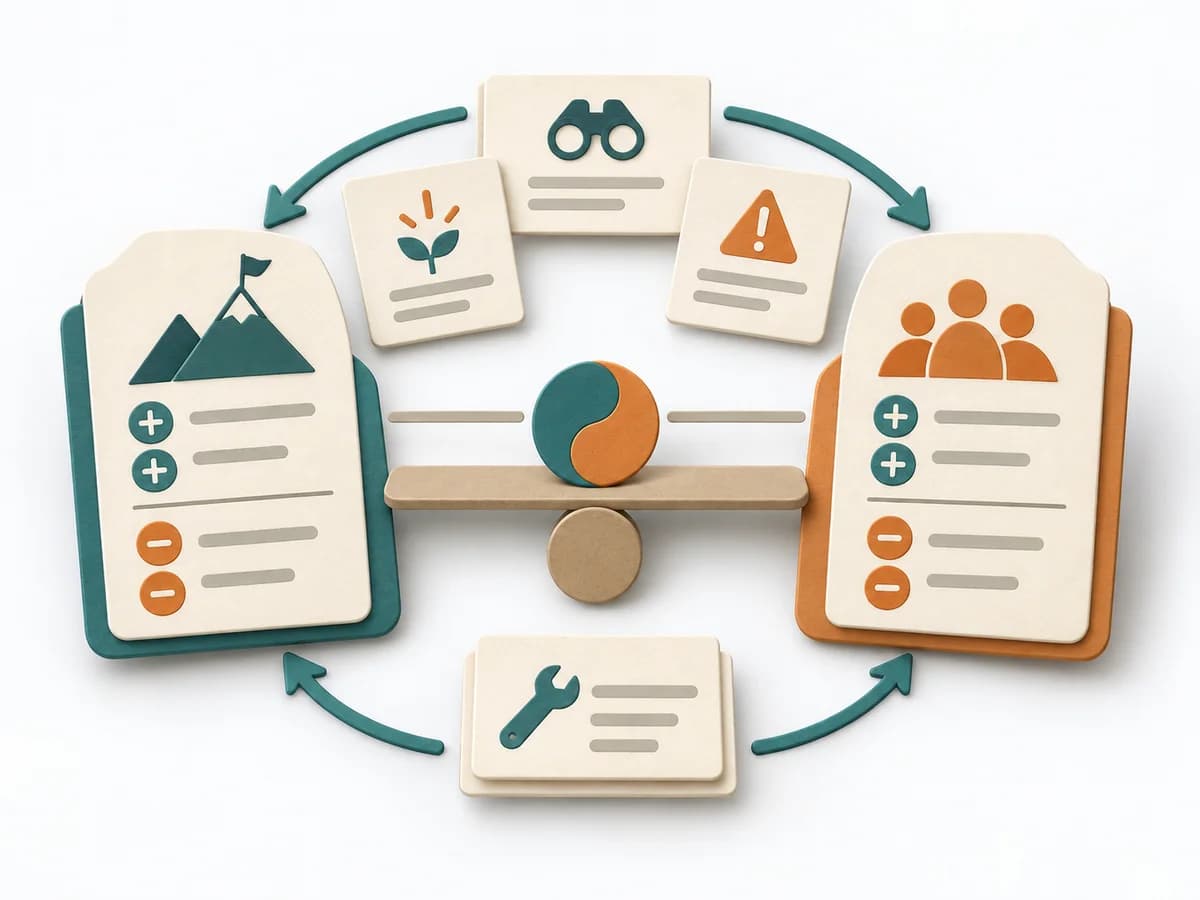 Systems Thinking Polarity Mapping | 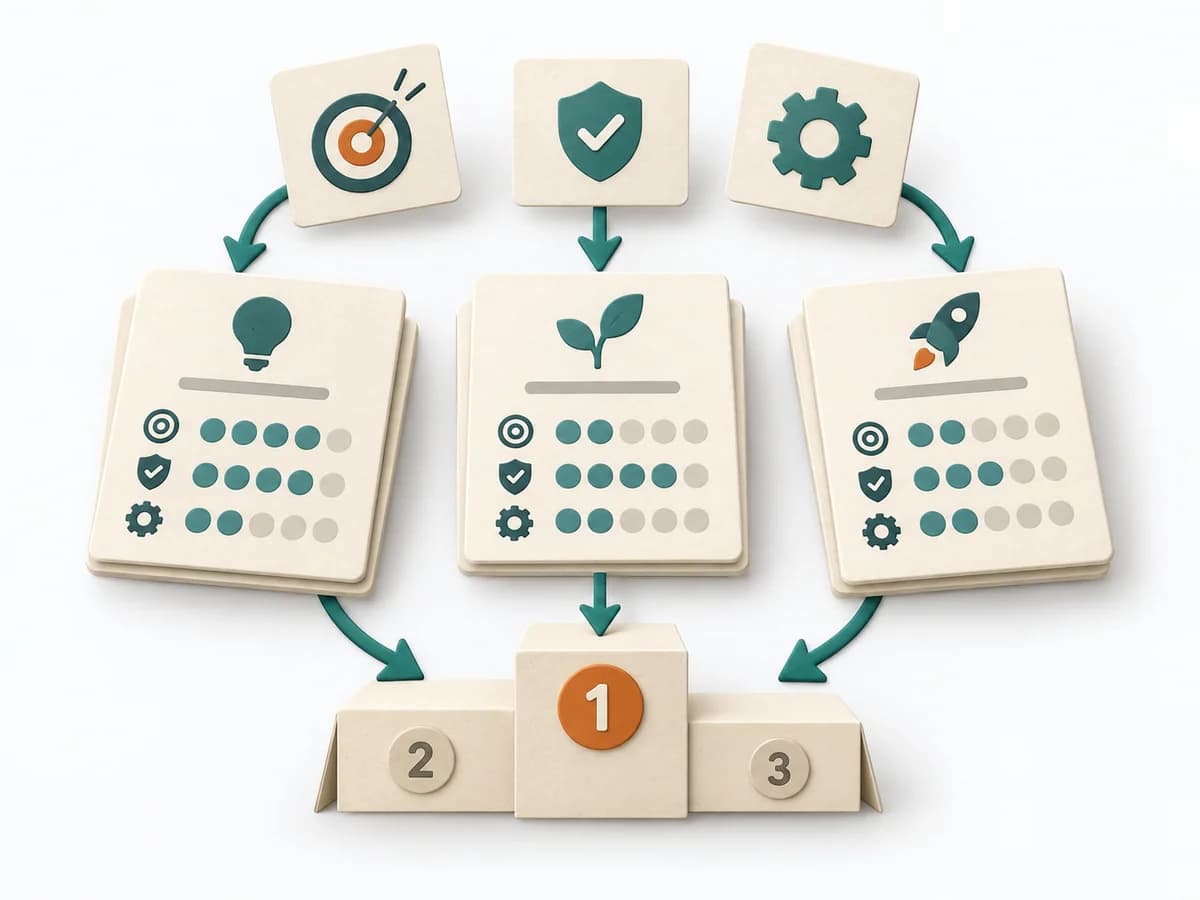 Product Strategy ICE Scoring |
|---|---|---|---|---|
Purposedifferent | When many initiatives compete for the same resources, it brings reach, impact, confidence, and effort into one shared ranking. It makes prioritization economically connectable. | The method makes visible why two seemingly incompatible demands arise and which assumption must be tested to resolve the conflict. | Polarity Mapping makes tensions between two opposing poles tangible, such as standardization and adaptation or control and autonomy. The method guards against making apparent either-or decisions prematurely. | When ideas need sorting quickly, it condenses impact, confidence, and effort into one compact score. It connects customer value, product logic, and decision priorities. The result is captured as an ICE table and top-ideas list. |
Complexitydifferent | Medium | Medium | Medium | Low |
Timedifferent | 60-90 min | 60-120 min | 1-2 h | 30-60 min |
Participantsdifferent | 2-10 | 2-8 | 3-12 | 2-8 |
Formatdifferent | Workshop + async | Workshop | Workshop | Workshop + async |
Outputdifferent | RICE Scores, Ranked List, Assumption Log | Conflict Cloud, Assumption List, Breakthrough Ideas, Next Experiments | Polarity Map, Warning Signs, Balance Actions | ICE Table, Top Idea List |
Tagsno overlap | PrioritizationScoringRoadmapTradeoffs | Theory of ConstraintsAssumptionsSystems thinking | Systems thinkingTradeoffsLeadership | PrioritizationScoringGrowthDecision |