View methods side by side.
Choose up to four methods. Add them using the search and share the comparison by copying its link.
| Criterion | 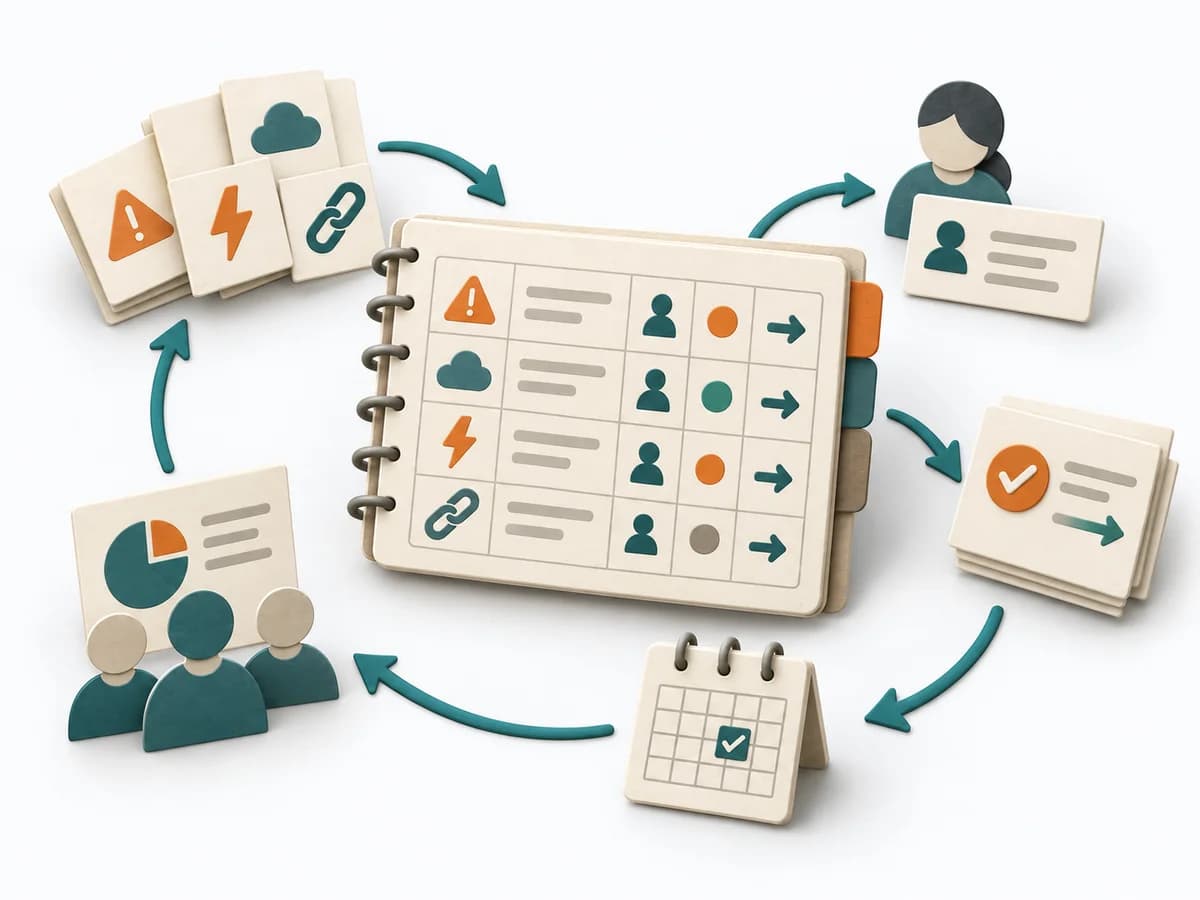 Delivery RAID Log |  Growth Pirate Metrics AARRR |
|---|---|---|
Purposedifferent | Helps clarify scope, sequence, and delivery flow in concrete terms. It makes work, boundaries, and order steerable. The result is captured as a RAID Log and a source for status reporting. | For products with complex usage paths, overall growth alone is too coarse to reveal bottlenecks. Pirate Metrics breaks the relationship with the product into consecutive stages and shows where the funnel actually leaks. |
Complexitydifferent | Low | Medium |
Timedifferent | 30 min Setup, dann laufend | 1-2 h Setup, laufend |
Participantsdifferent | 1-3 maintaining, briefing for everyone | 2-8 |
Formatdifferent | Async | Workshop + async |
Outputdifferent | RAID Log, Status Report Source | AARRR funnel, Metric baseline, Experiment backlog |
Tagsno overlap | RiskTrackingStakeholdersGovernance | GrowthMetricsExperiments |
Often compared together
Methods with strong topical overlap with the current selection, not yet in the comparison.