View methods side by side.
Choose up to four methods. Add them using the search and share the comparison by copying its link.
| Criterion | 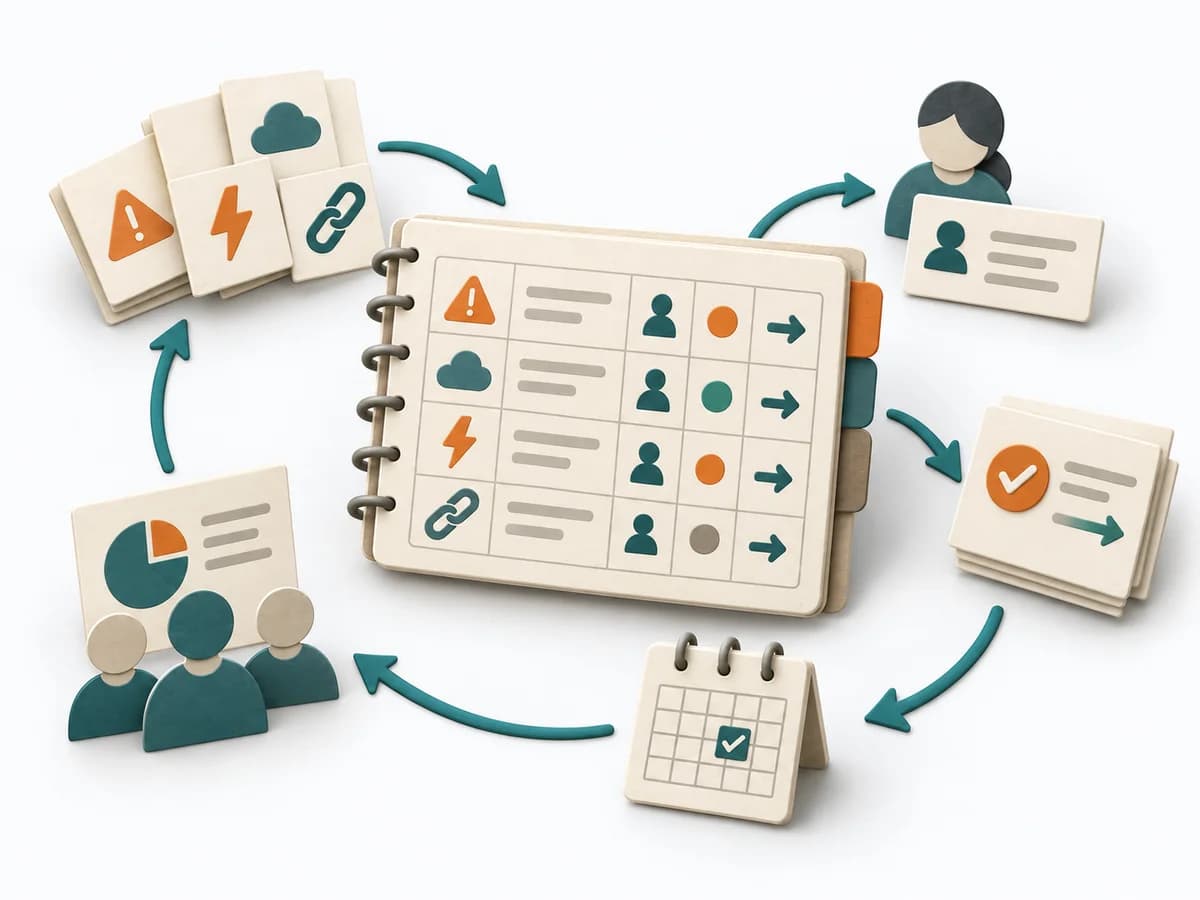 Delivery RAID Log |  Operations Failure Mode and Effects Analysis |  UX Design Service Blueprinting |  UX Design Customer Journey Canvas |
|---|---|---|---|---|
Purposedifferent | Helps clarify scope, sequence, and delivery flow in concrete terms. It makes work, boundaries, and order steerable. The result is captured as a RAID Log and a source for status reporting. | For a process, product, or service with noticeable failure risks, the method assesses possible failure modes in advance. It directs attention to combinations of occurrence, effect, and detectability. | When a service experience is spread across several touchpoints, it brings frontstage and backstage together. It shows where user contact and internal responsibility must fit. | When a journey needs to be understood across several phases, it arranges experience, touchpoints, and opportunities into one picture. It makes gaps and friction along the user path clear. |
Complexitydifferent | Low | High | High | Medium |
Timedifferent | 30 min Setup, dann laufend | 2-6 h | 0.5-2 Tage | 1-3 h |
Participantsdifferent | 1-3 maintaining, briefing for everyone | 3-10 | 6-12 | 3-10 |
Formatdifferent | Async | Workshop | Workshop | Workshop |
Outputdifferent | RAID Log, Status Report Source | FMEA Table, Risk Priority, Mitigation Actions | Service Blueprint, Fail Points, Ownership Map | Customer Journey Canvas, Pain Points, Experience Opportunities |
Tagsno overlap | RiskTrackingStakeholdersGovernance | RiskQualityOperationsRoot cause | Service designOperationsJourneyBlueprint | JourneyCustomerService designCanvas |