View methods side by side.
Choose up to four methods. Add them using the search and share the comparison by copying its link.
| Criterion |  Decision Making Radar | 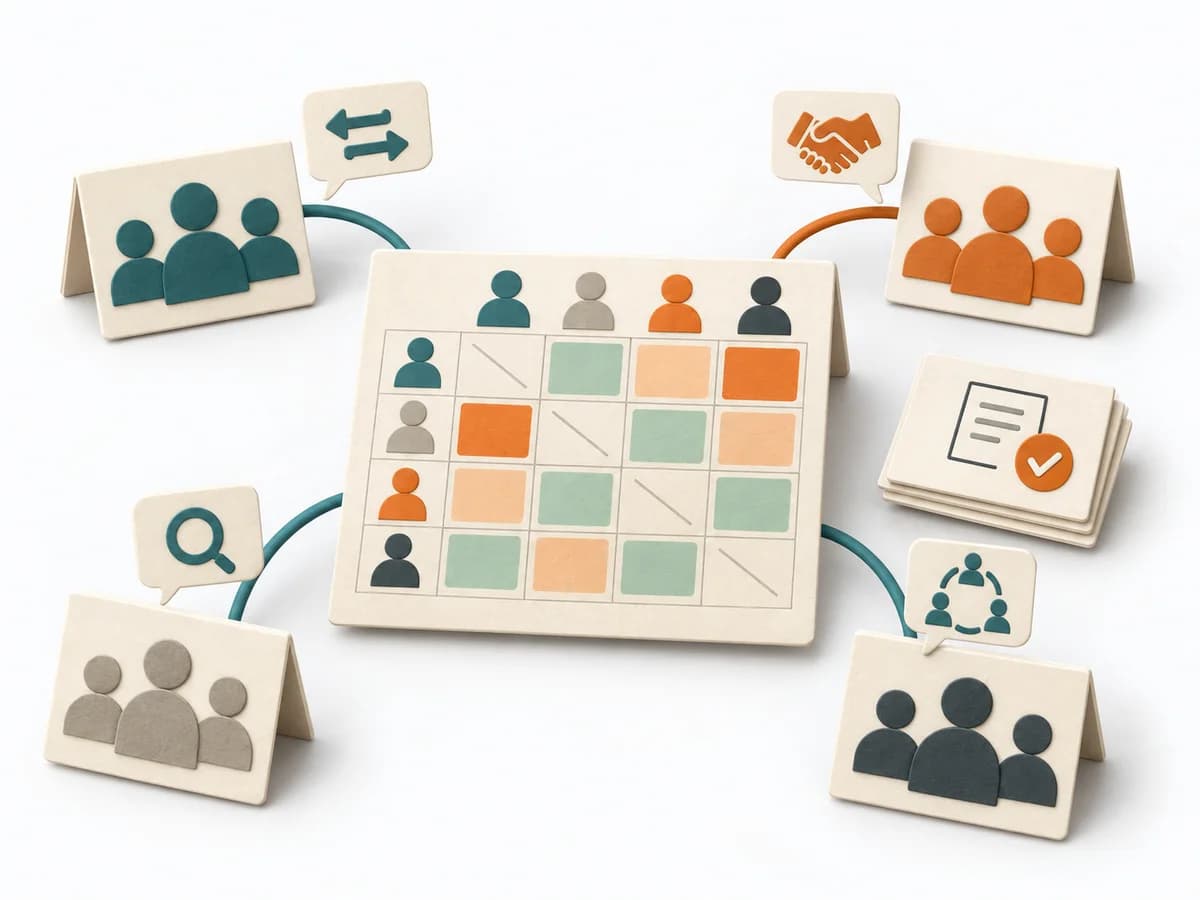 Team Design Team Topologies Interaction Modes |  Facilitation Expectation Mapping | 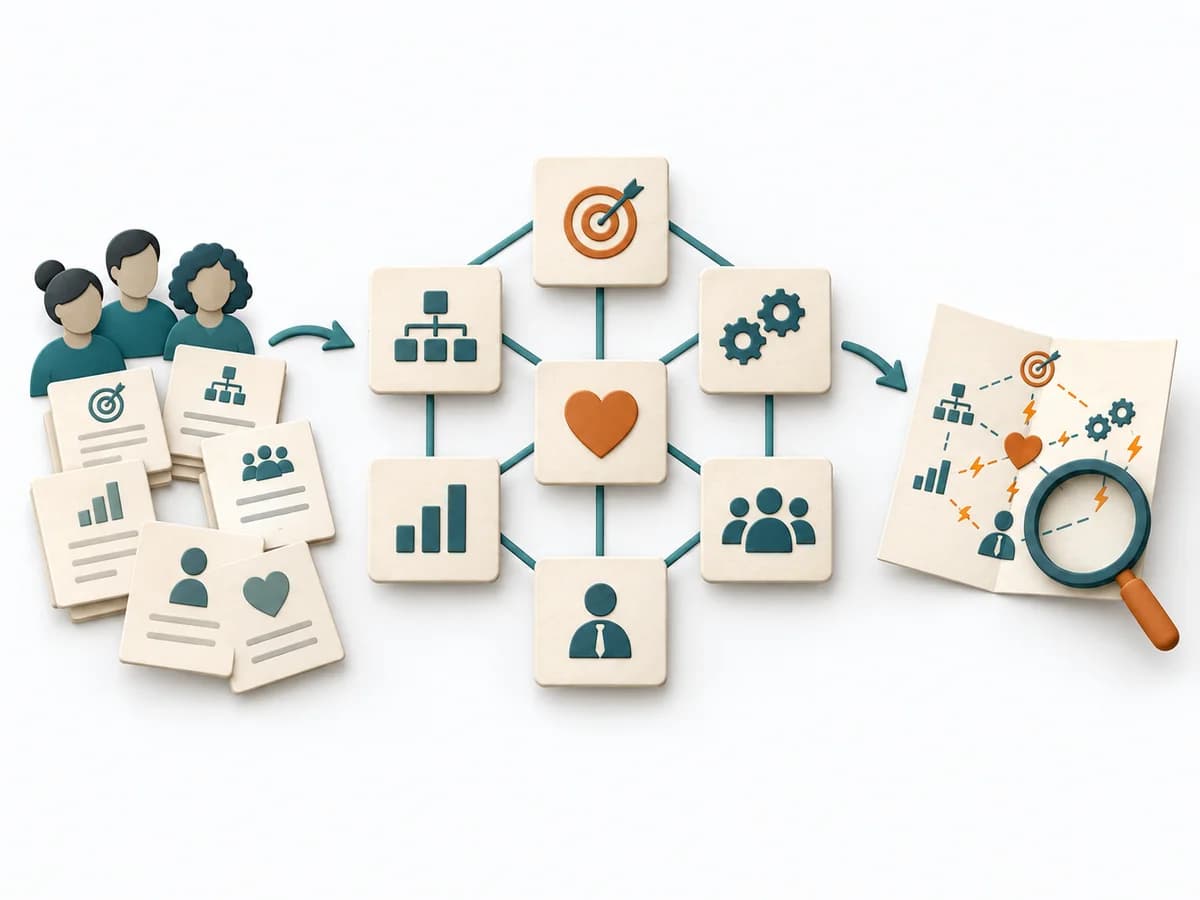 Business Strategy McKinsey 7S |
|---|---|---|---|---|
Purposedifferent | When capabilities, maturity levels, or market positions need to be compared across several dimensions, overview is easily lost. Radar brings different characteristics into a shared picture and shows patterns faster than tables do. | When several teams collaborate repeatedly, it describes the right interaction mode for each interface between them. It clarifies responsibility, interaction, and load between teams. The result is captured as an interaction heat map and pairwise agreements. | When roles, interfaces, or projects fail because of differing expectations, Expectation Mapping surfaces these differences. It shows what each side takes for granted and where the pictures diverge. | McKinsey 7S checks whether Strategy, Structure, Systems, Shared Values, Skills, Style, and Staff fit together. Organizational misalignments become visible across multiple levers as a result. |
Complexitydifferent | Medium | Medium | Low | Medium |
Timedifferent | 1-2 h | Half day | 45-90 min | 2-4 h |
Participantsdifferent | 2-10 | Team-Leads plus Architecture | 3-12 | 3-12 |
Formatdifferent | Workshop + async | Workshop | Workshop | Workshop |
Outputdifferent | Radar Map, Capability Scores, Action Areas | Interaction Heat Map, Agreements per Pair | Expectation Map, Alignment Notes, Agreements | 7S Assessment, Alignment Gaps, Change Actions |
Tagsno overlap | AssessmentPortfolioCapability | TeamAlignmentCollaborationOrganization | AlignmentStakeholdersTeam | OrganizationStrategyAlignmentChange |