View methods side by side.
Choose up to four methods. Add them using the search and share the comparison by copying its link.
| Criterion |  Decision Making Radar | 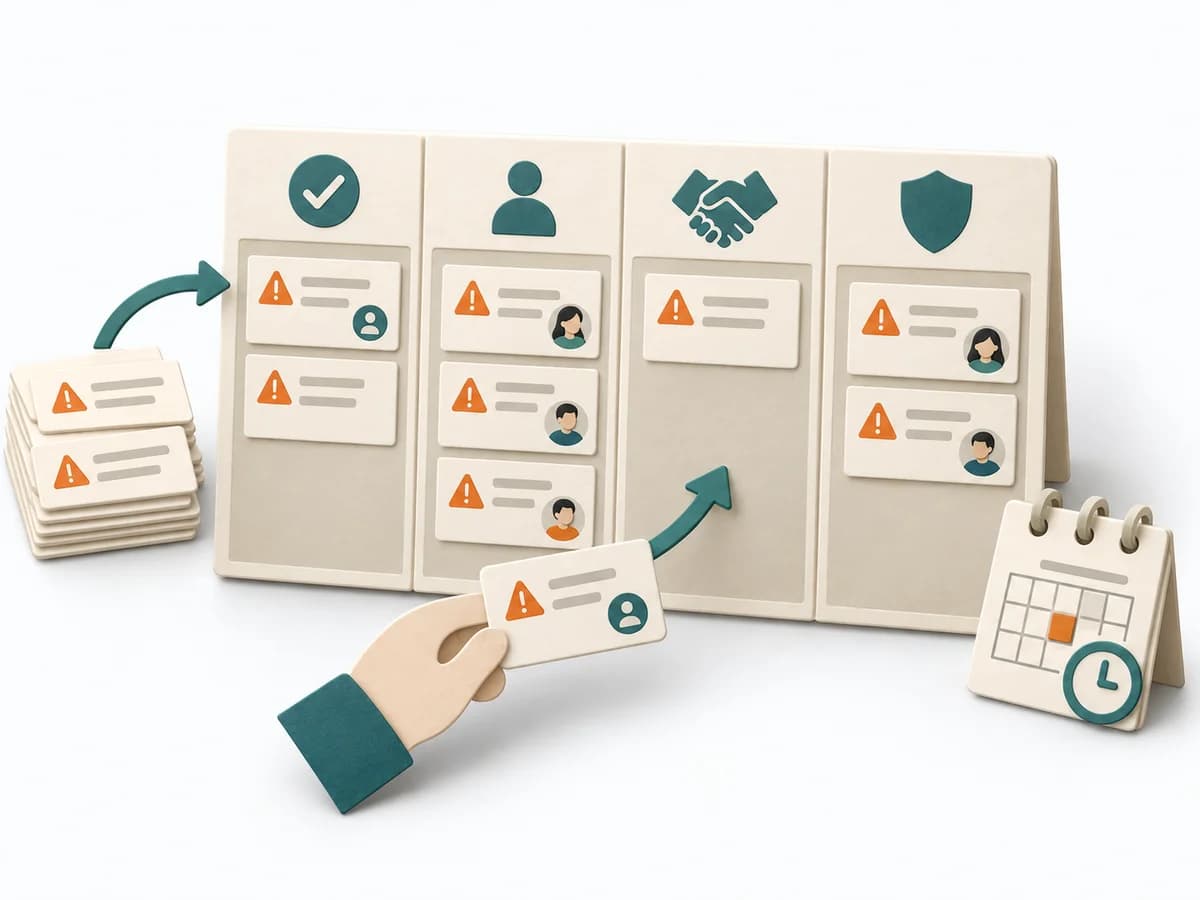 Agile ROAM Board | 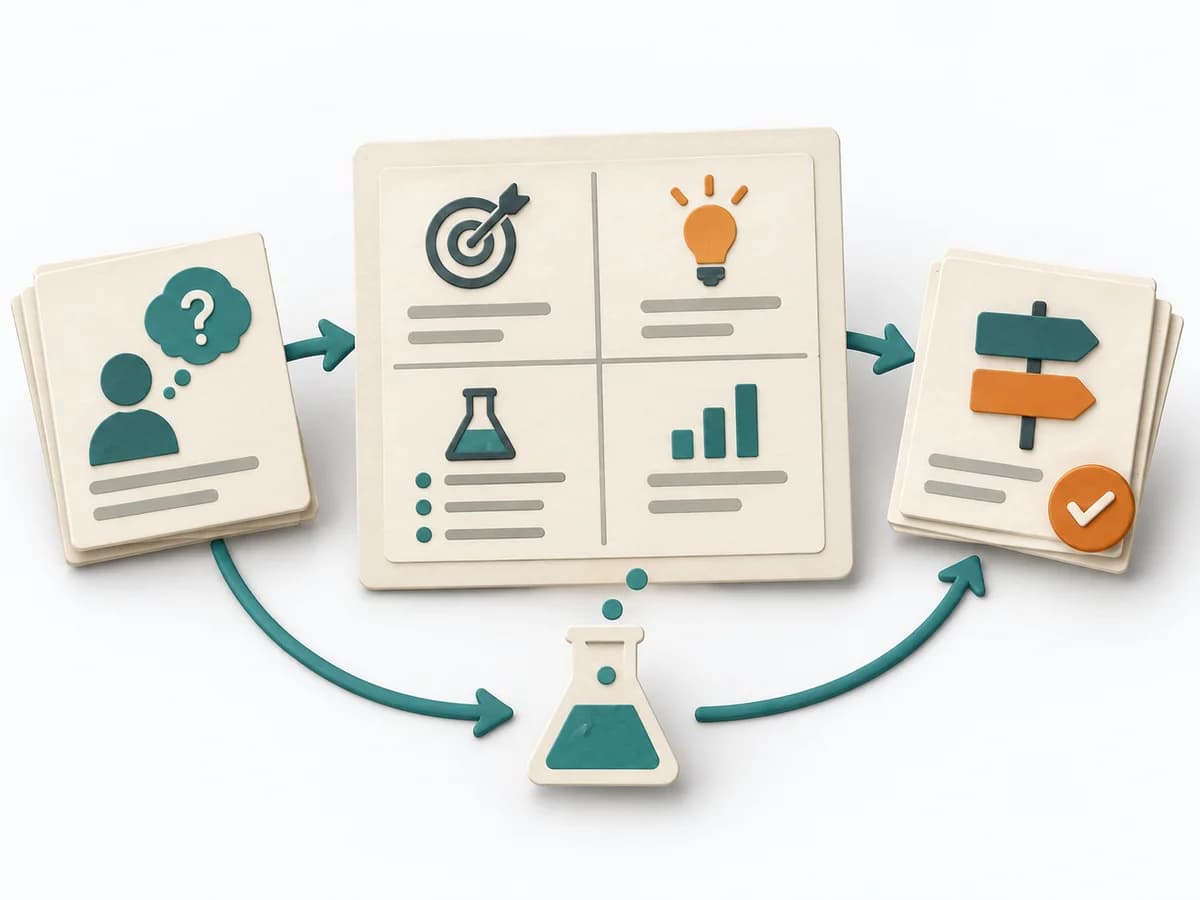 Product Discovery Experiment Canvas | 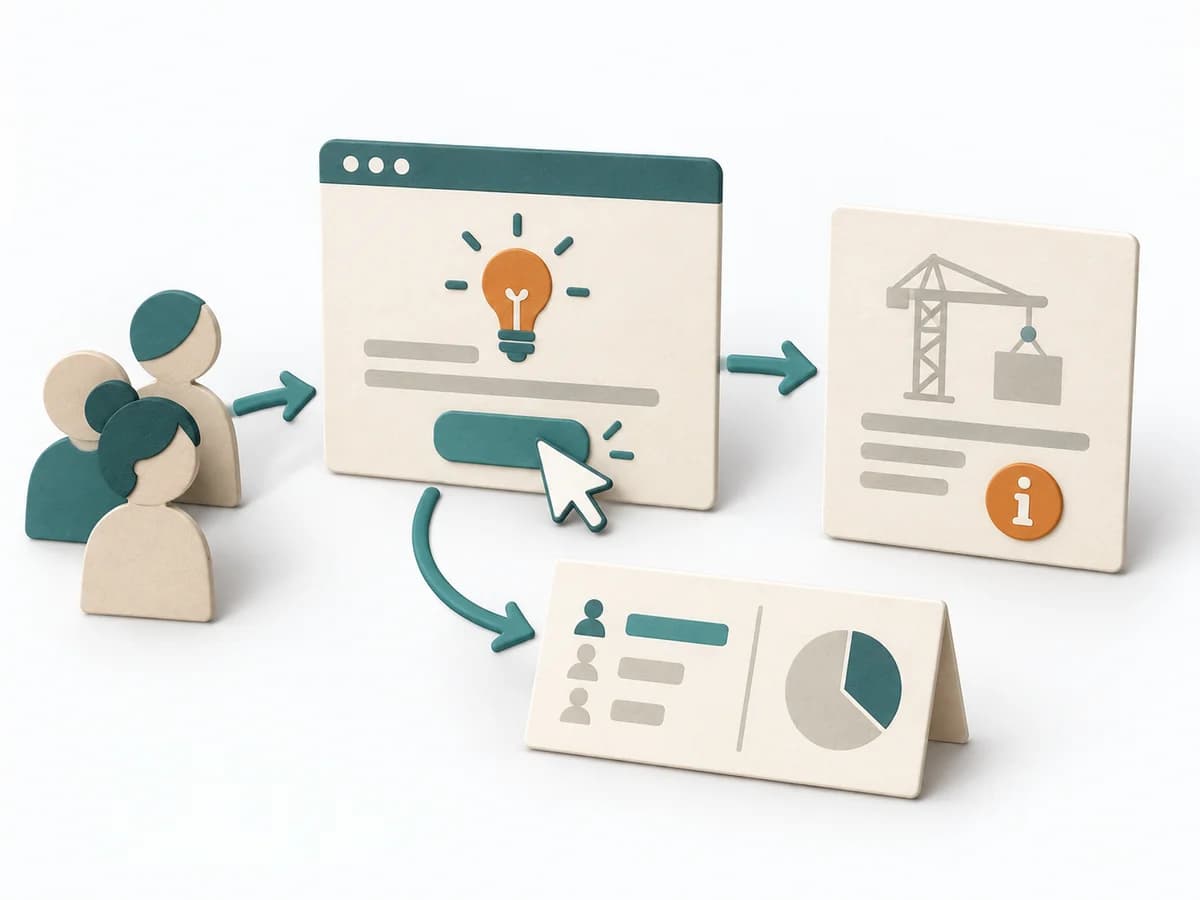 Product Discovery Fake Door Test |
|---|---|---|---|---|
Purposedifferent | When capabilities, maturity levels, or market positions need to be compared across several dimensions, overview is easily lost. Radar brings different characteristics into a shared picture and shows patterns faster than tables do. | When work needs to move between different states or columns, it makes that movement and its handoffs legible. It sorts work by value, risk, and delivery ability. The result is captured as a ROAM Board and an Owner List. | When experiments become unreadable after the fact, it arranges hypothesis, signal, and learning goal on a single canvas. It separates problem, assumption, solution, and evidence. The result is captured as a Completed Experiment Canvas and a Success Metric. | When demand is still unclear, it measures interest in a feature before it is built. It separates real behavior from polite agreement and deliberately keeps build effort small. |
Complexitydifferent | Medium | Low | Low | Medium |
Timedifferent | 1-2 h | 20-40 min initial, dann laufend | 30-60 min | 1-5 Tage |
Participantsdifferent | 2-10 | 3-15 | 1-5 | Nutzertraffic |
Formatdifferent | Workshop + async | Workshop + async | Workshop + async | Async |
Outputdifferent | Radar Map, Capability Scores, Action Areas | ROAM Board, Owner List | Completed Experiment Canvas, Success Metric | Click Data, Interest Signal, Learning Decision |
Tagsno overlap | AssessmentPortfolioCapability | RiskAgileTrackingAlignment | ExperimentsValidationDiscoveryHypothesis | ValidationExperimentsDemandDiscovery |