View methods side by side.
Choose up to four methods. Add them using the search and share the comparison by copying its link.
| Criterion |  Decision Making Radar | 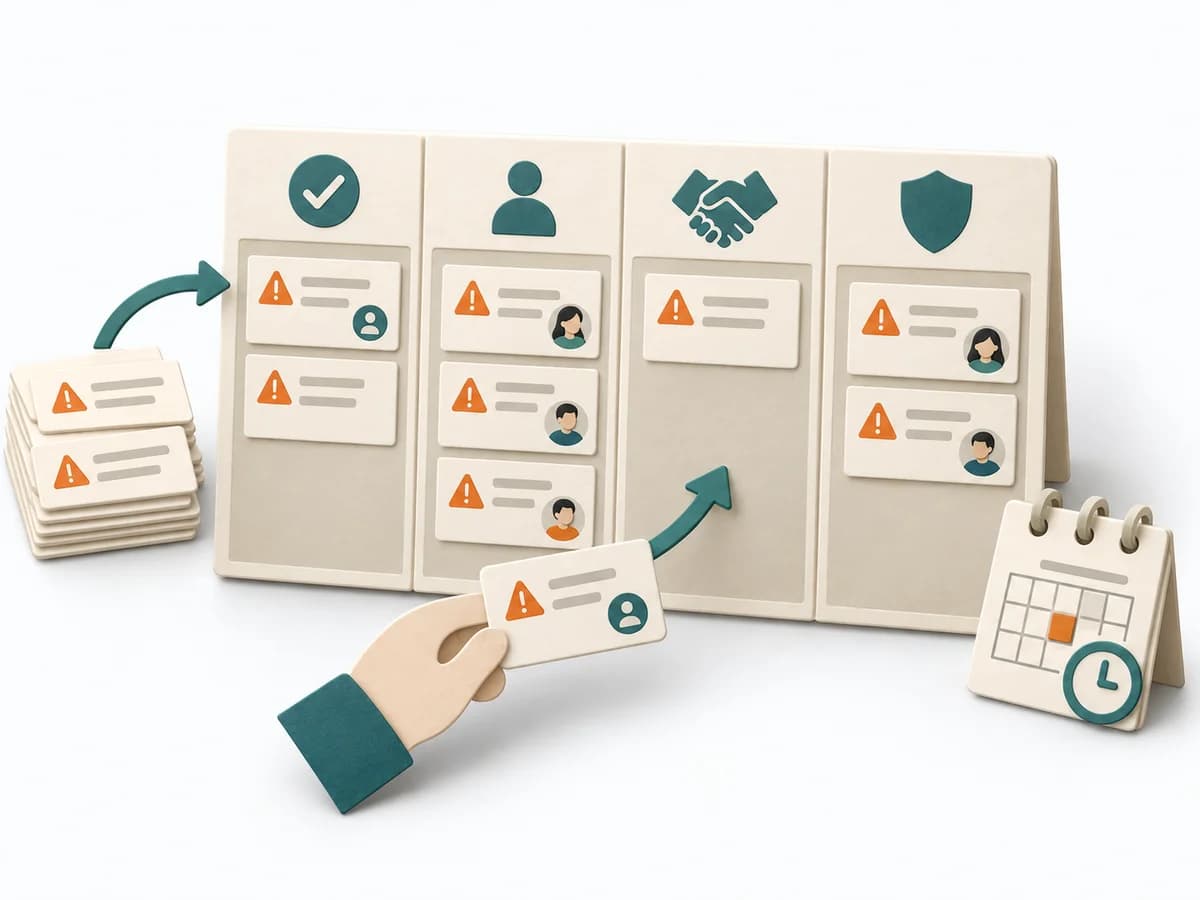 Agile ROAM Board |  Operations 5 Whys |  Operations A3 Problem Solving |
|---|---|---|---|---|
Purposedifferent | When capabilities, maturity levels, or market positions need to be compared across several dimensions, overview is easily lost. Radar brings different characteristics into a shared picture and shows patterns faster than tables do. | When work needs to move between different states or columns, it makes that movement and its handoffs legible. It sorts work by value, risk, and delivery ability. The result is captured as a ROAM Board and an Owner List. | For a single, hard-to-explain deviation, the method exposes the causal chain behind the visible symptom. It keeps the cause open until a controllable condition emerges instead of a mere description. | For a complex deviation with several people involved, the method bundles problem, analysis, and decision onto one page. It creates a shared working space where causes, countermeasures, and follow-up fit together. |
Complexitydifferent | Medium | Low | Low | Medium |
Timedifferent | 1-2 h | 20-40 min initial, dann laufend | 15-30 min | 45-90 min |
Participantsdifferent | 2-10 | 3-15 | 2-6 | 2-5 |
Formatdifferent | Workshop + async | Workshop + async | Workshop | Workshop + async |
Outputdifferent | Radar Map, Capability Scores, Action Areas | ROAM Board, Owner List | Root cause notes, Countermeasures | A3 Report, Action Plan, Root Cause Analysis |
Tagsno overlap | AssessmentPortfolioCapability | RiskAgileTrackingAlignment | Root causeIncidentLeanProblem solving | LeanProblem solvingCoachingOperations |