View methods side by side.
Choose up to four methods. Add them using the search and share the comparison by copying its link.
| Criterion |  Decision Making Radar | 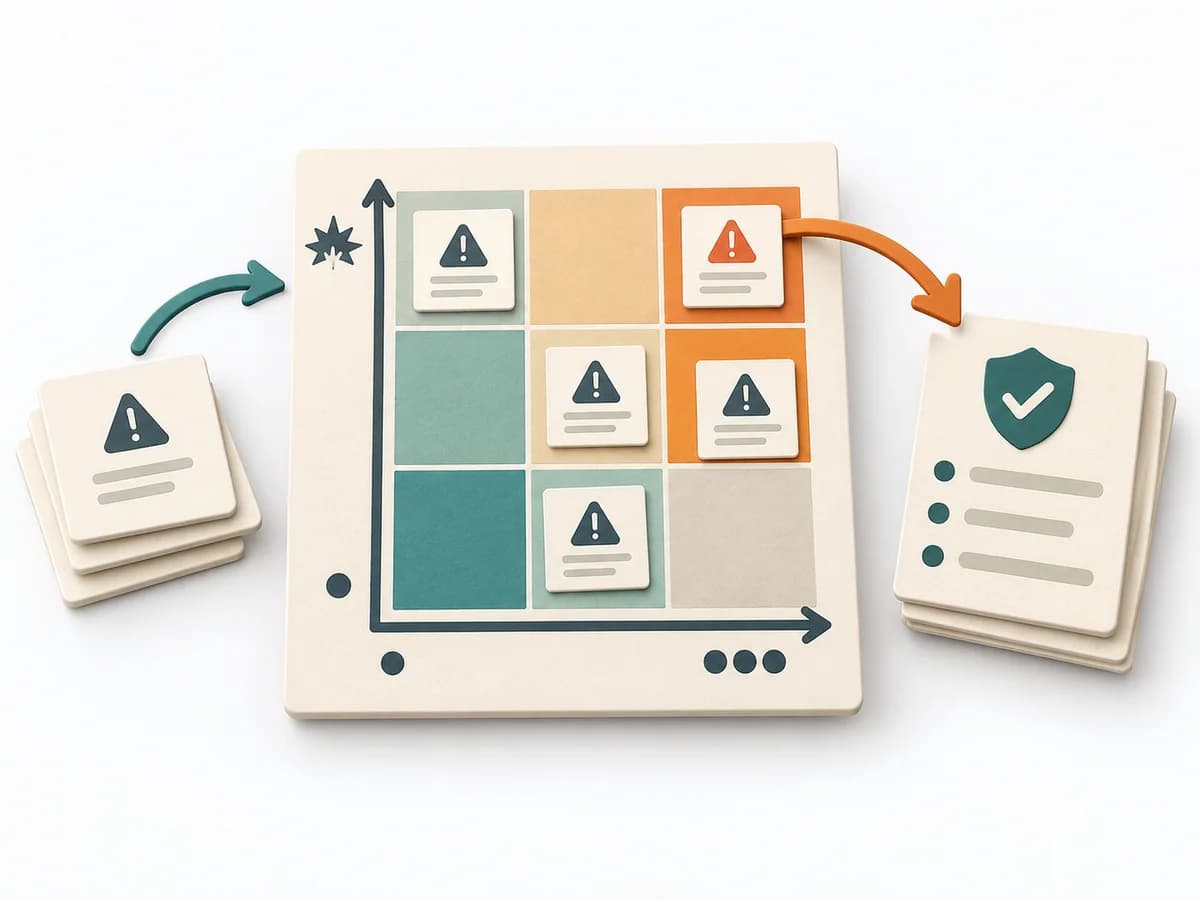 Decision Making Risk Matrix |  Operations Failure Mode and Effects Analysis | 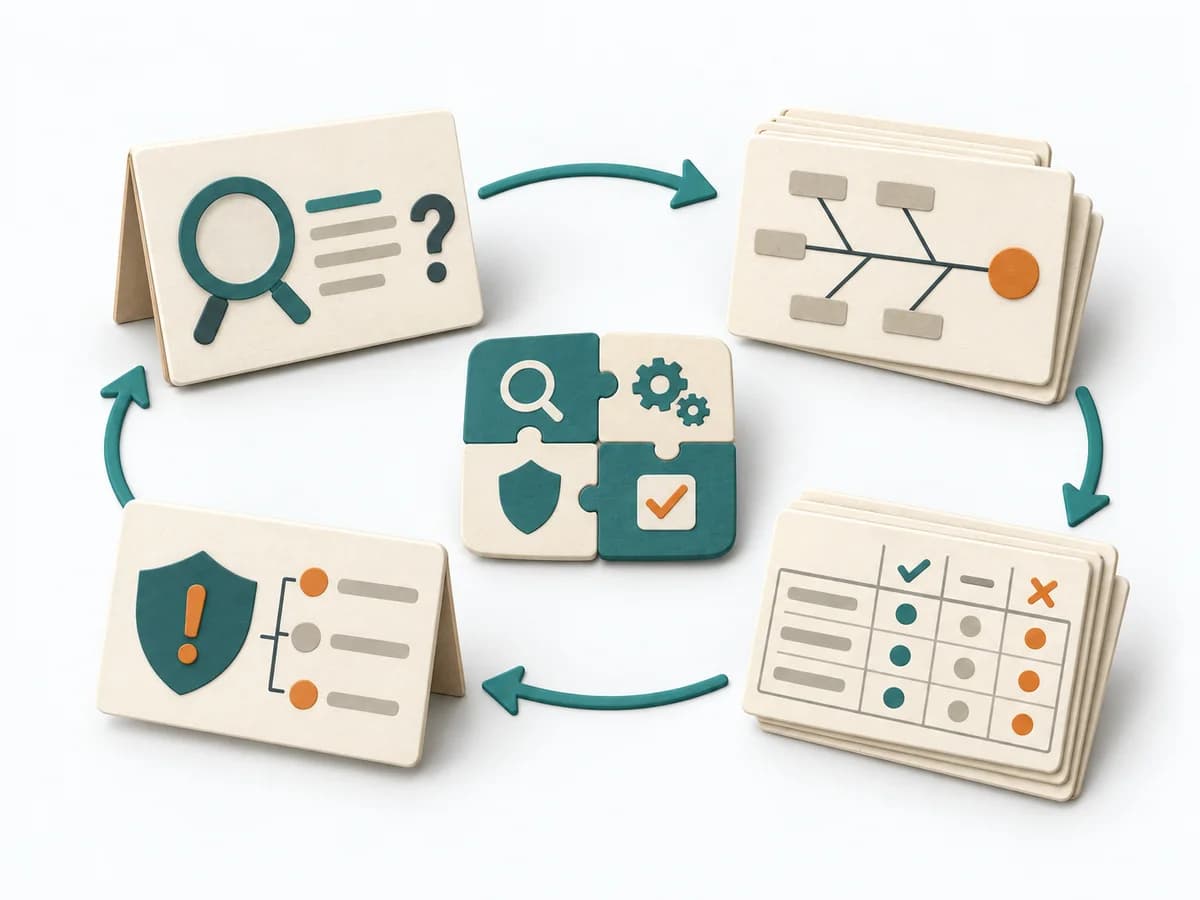 Operations Kepner-Tregoe |
|---|---|---|---|---|
Purposedifferent | When capabilities, maturity levels, or market positions need to be compared across several dimensions, overview is easily lost. Radar brings different characteristics into a shared picture and shows patterns faster than tables do. | When a project faces many possible disruptions, it quickly becomes unclear which risks deserve attention first. It separates options, evaluation criteria, and open risks. The result is captured as a Risk Matrix and a Top Risk List. | For a process, product, or service with noticeable failure risks, the method assesses possible failure modes in advance. It directs attention to combinations of occurrence, effect, and detectability. | For a disturbance that's hard to pin down, the method cleanly separates problem, cause, and decision. It reduces mixing when symptoms allow several interpretations. |
Complexitydifferent | Medium | Low | High | High |
Timedifferent | 1-2 h | 30-60 min | 2-6 h | 2-8 h |
Participantsdifferent | 2-10 | 3-10 | 3-10 | 2-8 |
Formatdifferent | Workshop + async | Workshop + async | Workshop | Workshop + async |
Outputdifferent | Radar Map, Capability Scores, Action Areas | Risk Matrix, Top Risk List | FMEA Table, Risk Priority, Mitigation Actions | Problem Analysis, Decision Analysis, Risk Plan |
Tagsno overlap | AssessmentPortfolioCapability | RiskDecisionPrioritizationAssessment | RiskQualityOperationsRoot cause | Problem solvingRoot causeDecisionOperations |