View methods side by side.
Choose up to four methods. Add them using the search and share the comparison by copying its link.
| Criterion |  Decision Making Radar | 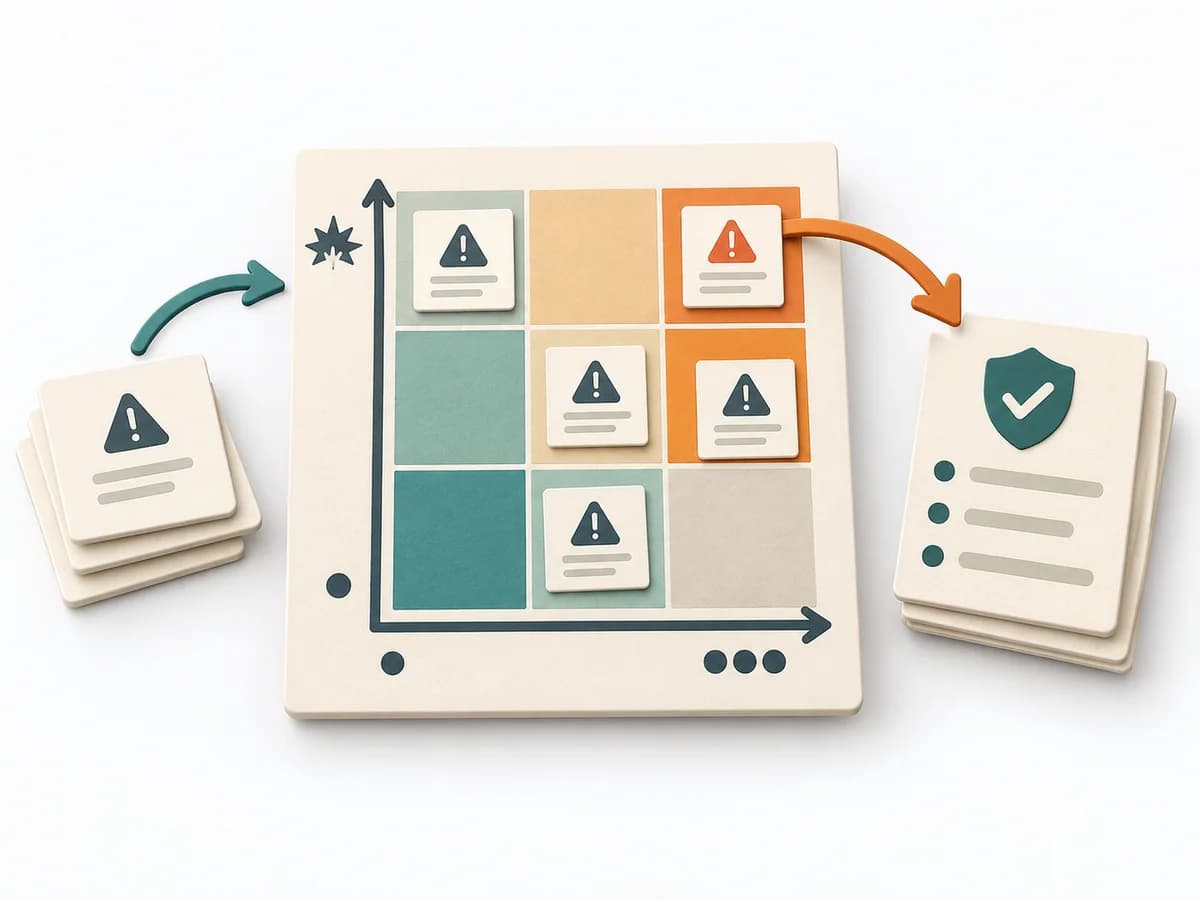 Decision Making Risk Matrix |  Growth A/B Testing |  Product Discovery Smoke Test |
|---|---|---|---|---|
Purposedifferent | When capabilities, maturity levels, or market positions need to be compared across several dimensions, overview is easily lost. Radar brings different characteristics into a shared picture and shows patterns faster than tables do. | When a project faces many possible disruptions, it quickly becomes unclear which risks deserve attention first. It separates options, evaluation criteria, and open risks. The result is captured as a Risk Matrix and a Top Risk List. | When two variants compete, discussions quickly decide by taste rather than effect. A/B Testing checks behavior under controlled conditions and separates real improvement from chance or expectation effects. | When demand only needs to be roughly verified, it tests interest with minimal effort. It measures whether people would take a next step at all. |
Complexitydifferent | Medium | Low | High | Low |
Timedifferent | 1-2 h | 30-60 min | 1-4 Wochen | 1-5 Tage |
Participantsdifferent | 2-10 | 3-10 | 1-6 | Nutzertraffic |
Formatdifferent | Workshop + async | Workshop + async | Async | Async |
Outputdifferent | Radar Map, Capability Scores, Action Areas | Risk Matrix, Top Risk List | Experiment results, Decision log, Learning summary | Interest Metrics, Conversion Signal, Learning Note |
Tagsno overlap | AssessmentPortfolioCapability | RiskDecisionPrioritizationAssessment | ExperimentsGrowthAnalyticsValidation | ValidationExperimentsDemandGrowth |