View methods side by side.
Choose up to four methods. Add them using the search and share the comparison by copying its link.
| Criterion |  Decision Making Radar | 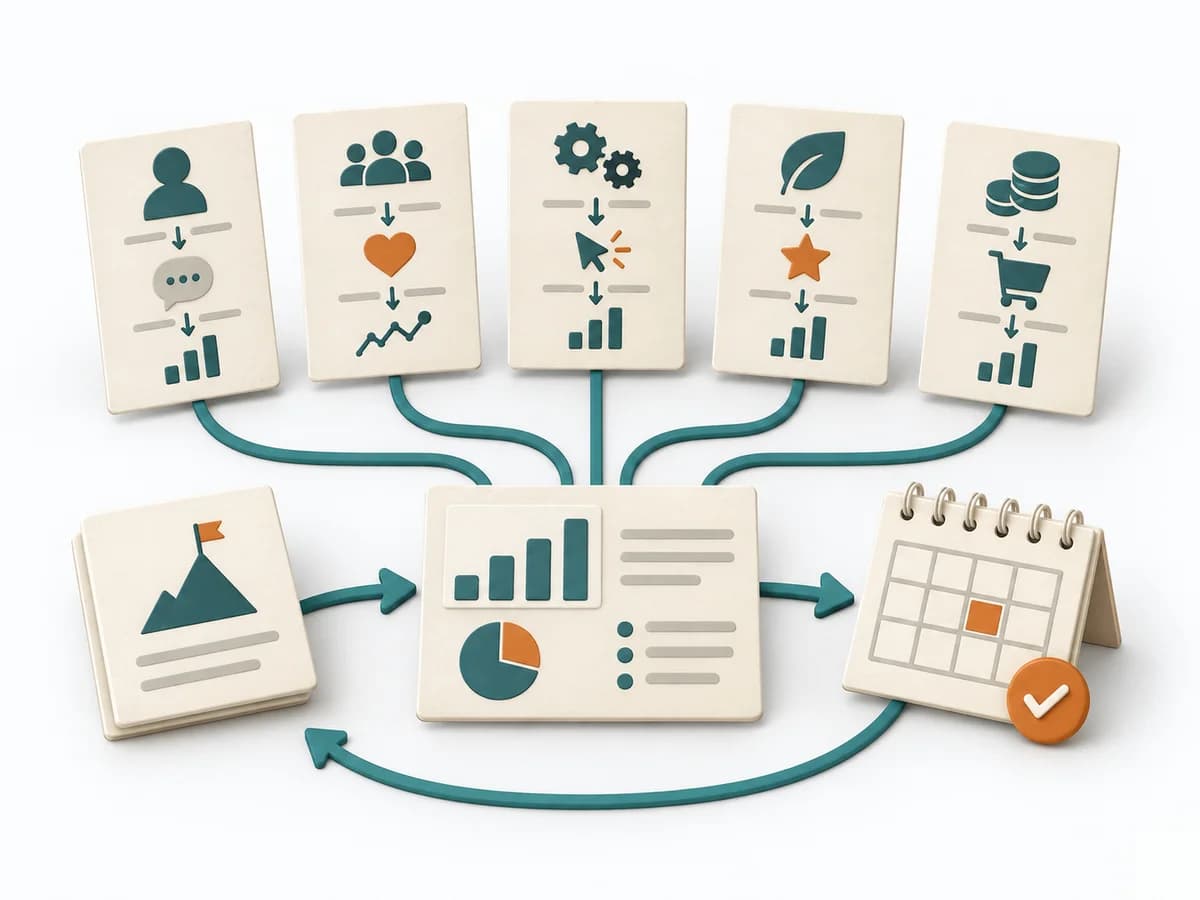 UX Research HEART Framework |  Operations Root Cause Analysis |  Operations Barrier Analysis |
|---|---|---|---|---|
Purposedifferent | When capabilities, maturity levels, or market positions need to be compared across several dimensions, overview is easily lost. Radar brings different characteristics into a shared picture and shows patterns faster than tables do. | Helps clarify observations, needs, and patterns in concrete terms. It groups observations into patterns, questions, and decisions. The result is captured as a HEART-GSM table and dashboard. | When a problem keeps recurring and the cause stays unclear, the method exposes the underlying mechanism. It separates symptom, guess, and robust explanation from one another. | For a risk that can only be managed through multiple layers of protection, the method examines the effectiveness of each barrier. It shows where safeguards are missing, too weak, or fail under real conditions. |
Complexitysame | Medium | Medium | Medium | Medium |
Timedifferent | 1-2 h | 120 min initial, dann laufend | 1-4 h | 2-4 h |
Participantsdifferent | 2-10 | 3-6 | 3-8 | 2-6 |
Formatsame | Workshop + async | Workshop + async | Workshop + async | Workshop + async |
Outputdifferent | Radar Map, Capability Scores, Action Areas | HEART-GSM Table, Dashboard | Problem Statement, Cause Hypotheses, Confirmed Causes, Action Plan | Barrier Inventory, Failure Analysis per Barrier, Action Backlog |
Tagsno overlap | AssessmentPortfolioCapability | MetricsUX researchMeasurementSatisfaction | Root causeProblem solvingQualityIncident | Root causeSafetyIncident |