View methods side by side.
Choose up to four methods. Add them using the search and share the comparison by copying its link.
| Criterion |  Decision Making Radar | 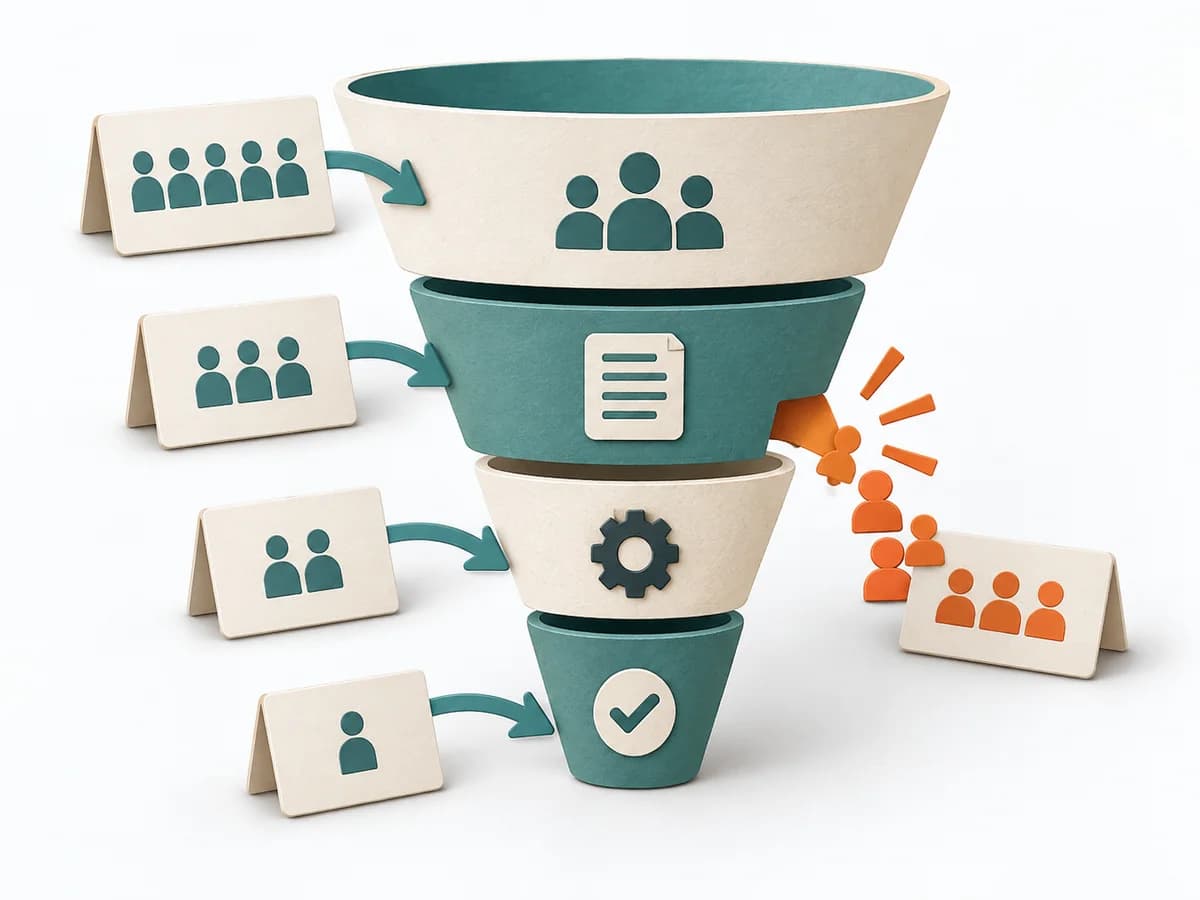 Growth Funnel Analysis |  Product Strategy ICE Scoring | 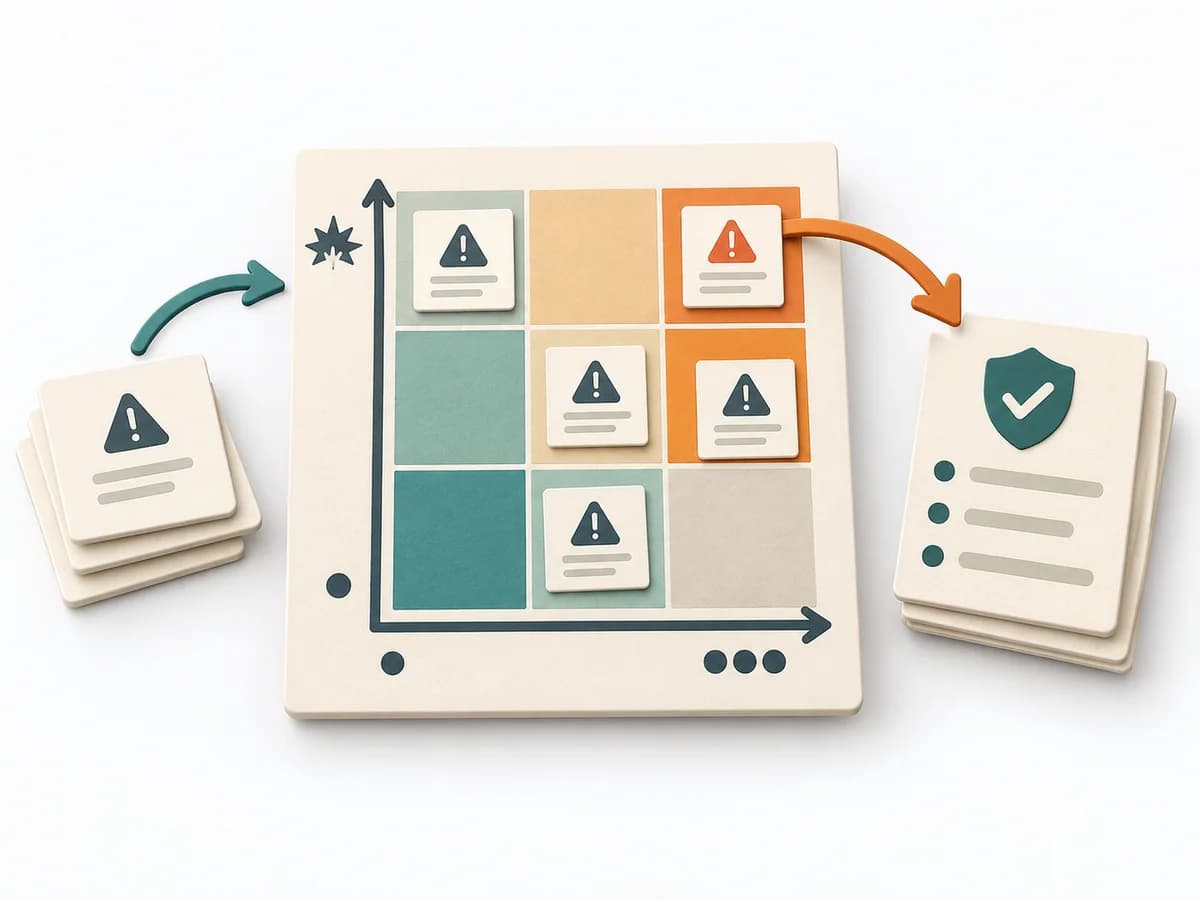 Decision Making Risk Matrix |
|---|---|---|---|---|
Purposedifferent | When capabilities, maturity levels, or market positions need to be compared across several dimensions, overview is easily lost. Radar brings different characteristics into a shared picture and shows patterns faster than tables do. | When many visitors or users drop off along the way, the reason behind the number often stays hidden. Funnel Analysis exposes these transitions and makes visible exactly where the path collapses. | When ideas need sorting quickly, it condenses impact, confidence, and effort into one compact score. It connects customer value, product logic, and decision priorities. The result is captured as an ICE table and top-ideas list. | When a project faces many possible disruptions, it quickly becomes unclear which risks deserve attention first. It separates options, evaluation criteria, and open risks. The result is captured as a Risk Matrix and a Top Risk List. |
Complexitydifferent | Medium | Medium | Low | Low |
Timedifferent | 1-2 h | 1-3 h | 30-60 min | 30-60 min |
Participantsdifferent | 2-10 | 1-5 | 2-8 | 3-10 |
Formatdifferent | Workshop + async | Async | Workshop + async | Workshop + async |
Outputdifferent | Radar Map, Capability Scores, Action Areas | Funnel report, Drop-off analysis, Optimization hypotheses | ICE Table, Top Idea List | Risk Matrix, Top Risk List |
Tagsno overlap | AssessmentPortfolioCapability | AnalyticsConversionGrowth | PrioritizationScoringGrowthDecision | RiskDecisionPrioritizationAssessment |