View methods side by side.
Choose up to four methods. Add them using the search and share the comparison by copying its link.
| Criterion |  Decision Making Radar |  Growth Flywheel |  Growth Hooked Model | 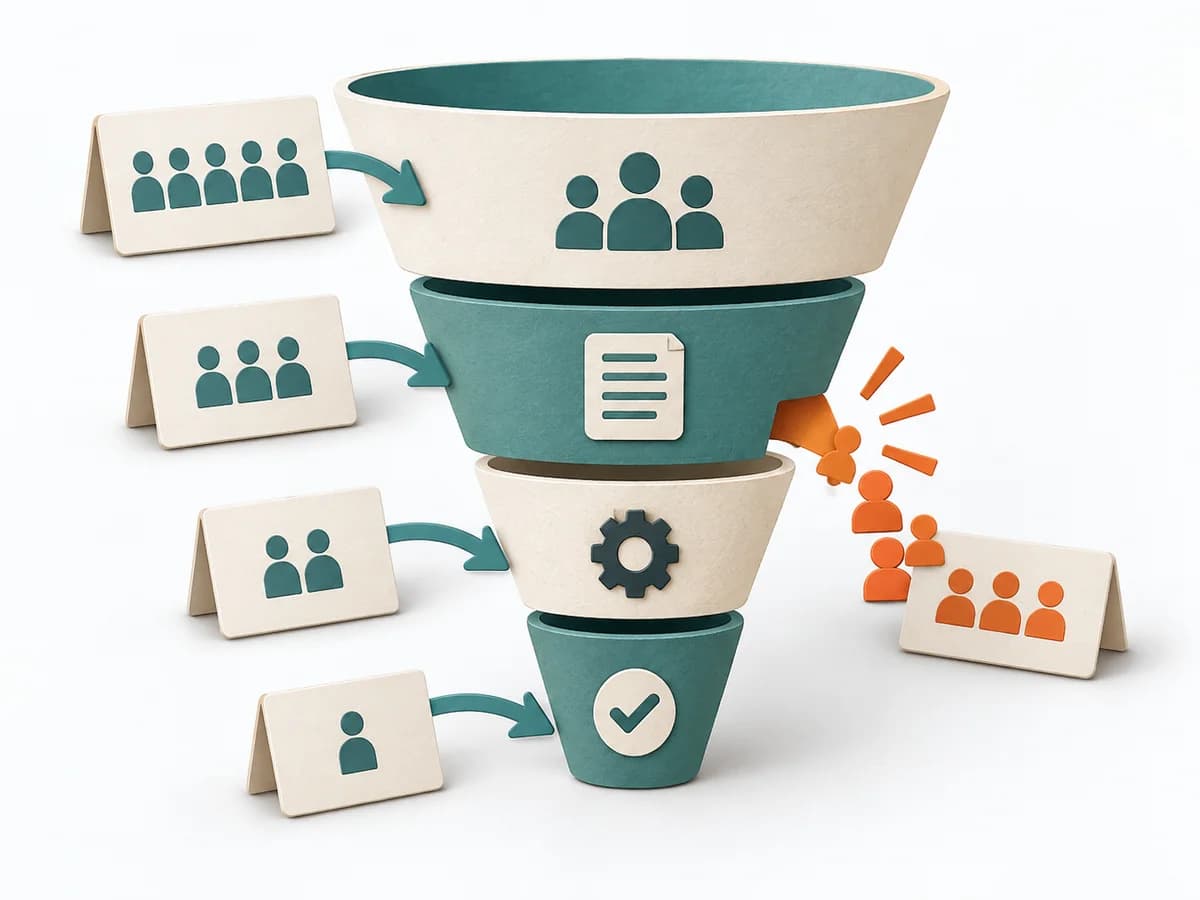 Growth Funnel Analysis |
|---|---|---|---|---|
Purposedifferent | When capabilities, maturity levels, or market positions need to be compared across several dimensions, overview is easily lost. Radar brings different characteristics into a shared picture and shows patterns faster than tables do. | Growth often breaks down where a reinforcing mechanism builds up too much friction. A Flywheel shows the cycle of value, repetition, and reinforcement meant to sustain growth. | The Hooked Model helps clarify engagement loops, user behavior, and experiments. It makes repeat behavior measurable and captures the result as a hooked loop, trigger map, and reward design. | When many visitors or users drop off along the way, the reason behind the number often stays hidden. Funnel Analysis exposes these transitions and makes visible exactly where the path collapses. |
Complexitysame | Medium | Medium | Medium | Medium |
Timedifferent | 1-2 h | 60-120 min | Multiple workshops over several weeks | 1-3 h |
Participantsdifferent | 2-10 | 3-8 | 2-8 | 1-5 |
Formatdifferent | Workshop + async | Workshop | Workshop + async | Async |
Outputdifferent | Radar Map, Capability Scores, Action Areas | Flywheel Map, Friction Points, Growth Levers, Experiment Backlog | Hooked loop, Trigger map, Reward design, Ethics check | Funnel report, Drop-off analysis, Optimization hypotheses |
Tagsno overlap | AssessmentPortfolioCapability | GrowthRetentionConversion | GrowthBehaviorRetention | AnalyticsConversionGrowth |