View methods side by side.
Choose up to four methods. Add them using the search and share the comparison by copying its link.
| Criterion |  Decision Making Radar |  Delivery Cost of Delay | 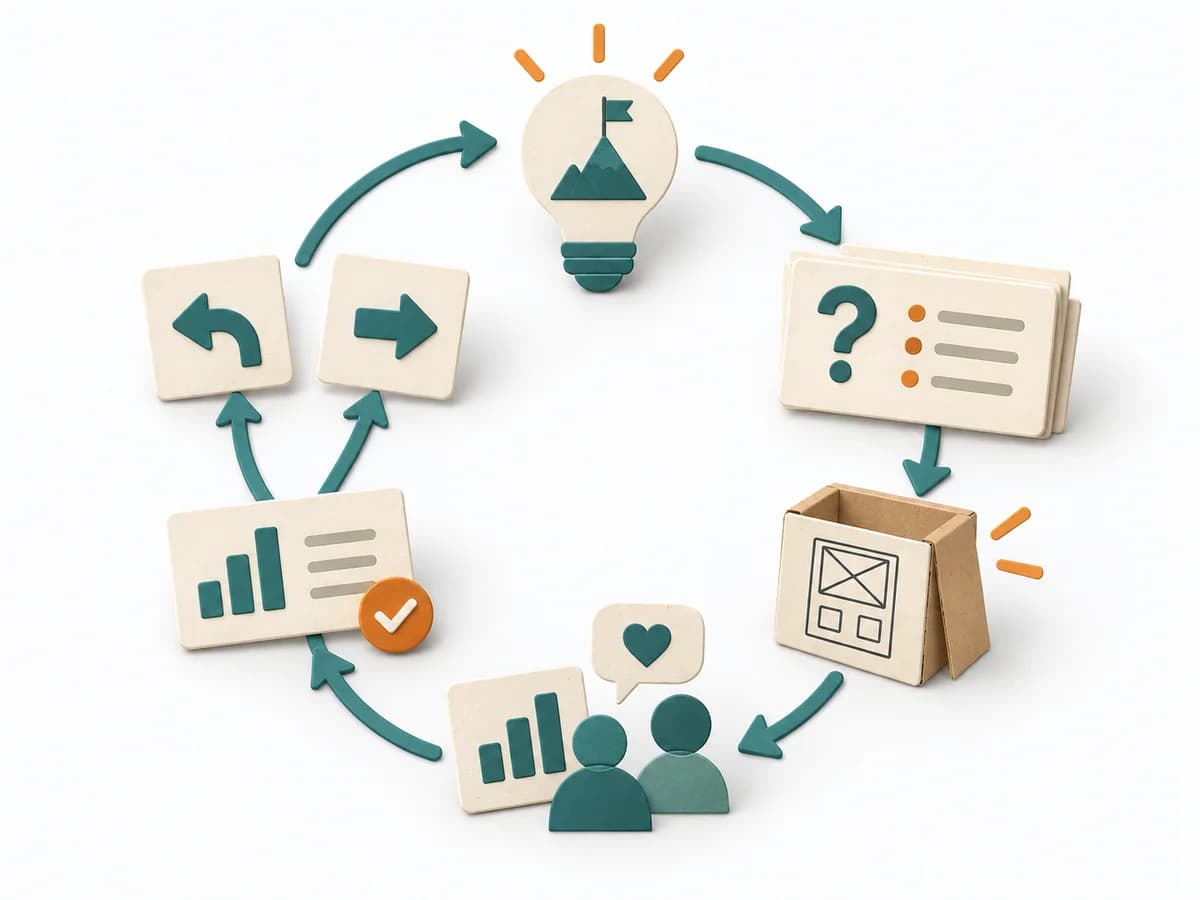 Innovation Lean Startup |  Operations ABC Analysis |
|---|---|---|---|---|
Purposedifferent | When capabilities, maturity levels, or market positions need to be compared across several dimensions, overview is easily lost. Radar brings different characteristics into a shared picture and shows patterns faster than tables do. | Helps clarify scope, order, and delivery flow in concrete terms. It makes work, constraints, and sequence manageable. The result is captured as a Cost of Delay table and prioritization sequence. | For uncertain business assumptions, the method forces the idea into contact with real market reactions early. It separates wishful picture, assumption, and observable behavior, so that learning becomes faster than planning. This translates uncertainty into measurable insight. | With many similar objects of differing economic significance, the method prioritizes effort by effect. It separates what needs regular steering from what rarely needs attention. |
Complexitydifferent | Medium | High | Medium | Low |
Timedifferent | 1-2 h | 90-180 min | Wochen bis Monate je Lernzyklus | 30-60 min |
Participantsdifferent | 2-10 | 3-8 | 2-8 | 1-5 |
Formatdifferent | Workshop + async | Workshop | Workshop + async | Async |
Outputdifferent | Radar Map, Capability Scores, Action Areas | CoD Table, Prioritization Sequence | Hypothesis list, MVPs, Learning reports, Pivot or persevere decision | ABC Classification, Focus Rules, Control List |
Tagsno overlap | AssessmentPortfolioCapability | PrioritizationDeliveryEconomicsDecision | LeanStartupValidationMVP | PrioritizationOperationsPortfolio |