View methods side by side.
Choose up to four methods. Add them using the search and share the comparison by copying its link.
| Criterion |  Decision Making Radar | 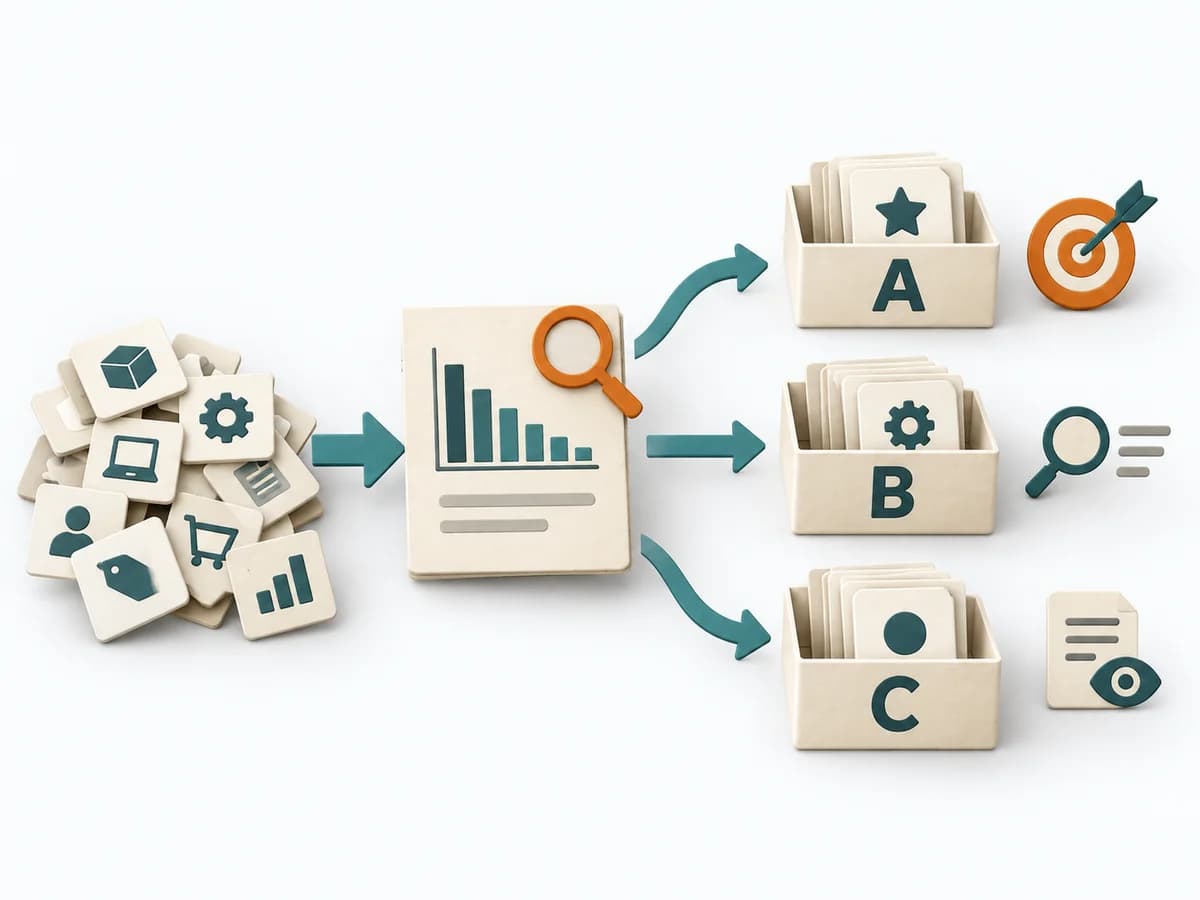 Operations ABC Analysis |  Systems Thinking Systems Mapping |  Systems Thinking Leverage Points |
|---|---|---|---|---|
Purposedifferent | When capabilities, maturity levels, or market positions need to be compared across several dimensions, overview is easily lost. Radar brings different characteristics into a shared picture and shows patterns faster than tables do. | With many similar objects of differing economic significance, the method prioritizes effort by effect. It separates what needs regular steering from what rarely needs attention. | Systems Mapping arranges elements, relationships, and boundaries so a complex field becomes legible at a glance. The overview stabilizes the overall picture before detail work or steering begins. | Leverage Points show exactly where interventions in a system produce a disproportionate effect. It draws relationships, patterns, and feedback loops. The result is captured as a leverage map and action strategy. |
Complexitydifferent | Medium | Low | Medium | High |
Timedifferent | 1-2 h | 30-60 min | 1-3 h | Half day |
Participantsdifferent | 2-10 | 1-5 | 3-12 | 3-12 |
Formatdifferent | Workshop + async | Async | Workshop + async | Workshop |
Outputdifferent | Radar Map, Capability Scores, Action Areas | ABC Classification, Focus Rules, Control List | System Map, Dependencies, Leverage Points | Leverage Map, Action Strategy |
Tagsno overlap | AssessmentPortfolioCapability | PrioritizationOperationsPortfolio | Systems thinkingMappingBoundariesChange | Systems thinkingChangeStrategy |