View methods side by side.
Choose up to four methods. Add them using the search and share the comparison by copying its link.
| Criterion |  Architecture Quality Attribute Workshop | 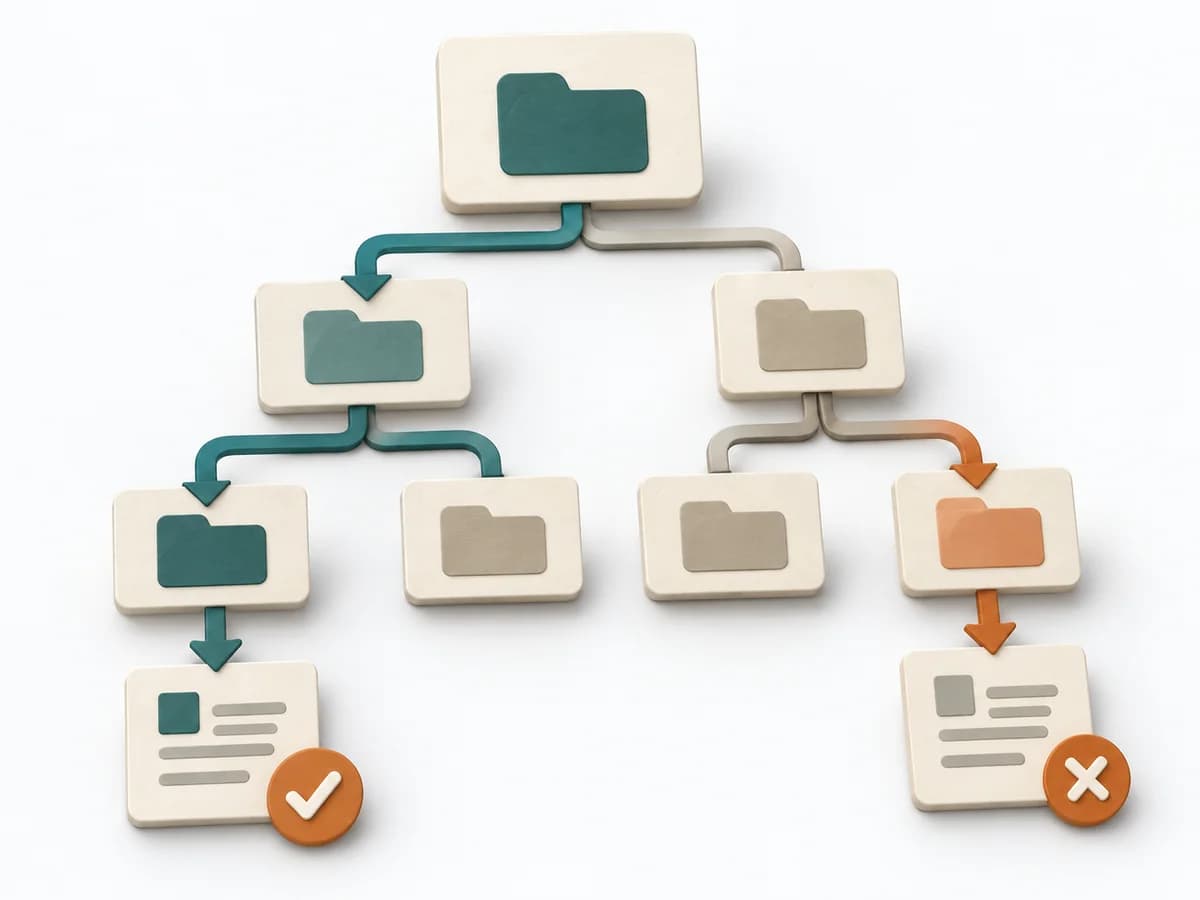 UX Research Tree Testing |  Operations Fishbone Diagram |
|---|---|---|---|
Purposedifferent | A Quality Attribute Workshop translates quality requirements into concrete scenarios and architecture impulses. The method brings product, engineering, and operations to the same view of desired properties. | When a navigation exists but search paths still fail, tree testing checks findability without visual distraction. The method shows whether labels, levels, and paths really lead to the intended destination. | When a problem has several possible contributing factors, the method sorts causes by cause areas. It prevents an initial hunch from blocking the view of other plausible drivers. |
Complexitydifferent | Medium | Medium | Low |
Timedifferent | 2-4 h | 1-2 Tage | 30-60 min |
Participantsdifferent | 5-15 | Based on research question | 2-8 |
Formatdifferent | Workshop | Async | Workshop |
Outputdifferent | Quality Scenarios, Priority List, Architecture Concerns | Findability Metrics, Path Analysis, Revised IA | Fishbone Diagram, Cause Categories, Investigation Backlog |
Tagsno overlap | RequirementsArchitectureWorkshop | Information architectureNavigationFindability | Root causeQualityOperations |
Often compared together
Methods with strong topical overlap with the current selection, not yet in the comparison.