View methods side by side.
Choose up to four methods. Add them using the search and share the comparison by copying its link.
| Criterion |  Product Strategy Product Canvas |  Operations Process Mapping | 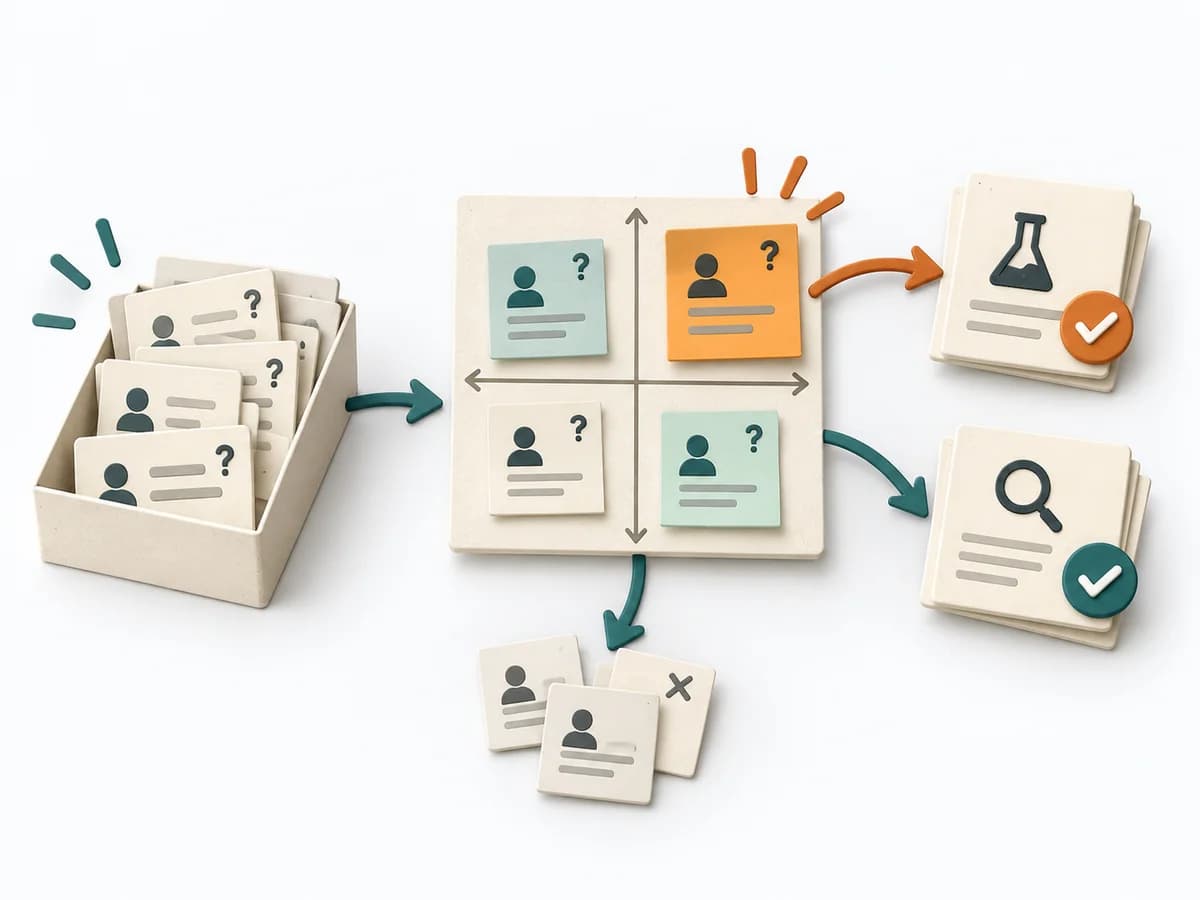 Decision Making Assumption Surfacing |  Operations Failure Mode and Effects Analysis |
|---|---|---|---|---|
Purposedifferent | When product goal and feature scope don't yet fit cleanly together, it creates a shared working picture. It connects need, core features, and assumptions into a solid starting point. | With a confusing workflow that has many handoffs, the method makes the actual process visible. It shows where work is passed on, delayed, or duplicated, so improvement targets the right spots. | Plans often contain assumptions that were never openly stated and remain dangerous precisely because of that. Assumption Surfacing makes these silent premises visible and prioritizes which of them carry the initiative or could sink it. | For a process, product, or service with noticeable failure risks, the method assesses possible failure modes in advance. It directs attention to combinations of occurrence, effect, and detectability. |
Complexitydifferent | Medium | Medium | Low | High |
Timedifferent | 1-2 h | 1-3 h | 45-90 min | 2-6 h |
Participantsdifferent | 2-8 | 3-10 | 2-8 | 3-10 |
Formatdifferent | Workshop + async | Workshop | Workshop + async | Workshop |
Outputdifferent | Product Canvas, Product Assumptions, Scope Notes | Process Map, Handoff List, Improvement Backlog | Assumption List, Critical Assumptions, Learning Plan | FMEA Table, Risk Priority, Mitigation Actions |
Tagsno overlap | CanvasDiscoveryScope | ProcessOperationsImprovement | AssumptionsRiskDecisionDiscovery | RiskQualityOperationsRoot cause |