View methods side by side.
Choose up to four methods. Add them using the search and share the comparison by copying its link.
| Criterion |  Operations Process Mapping | 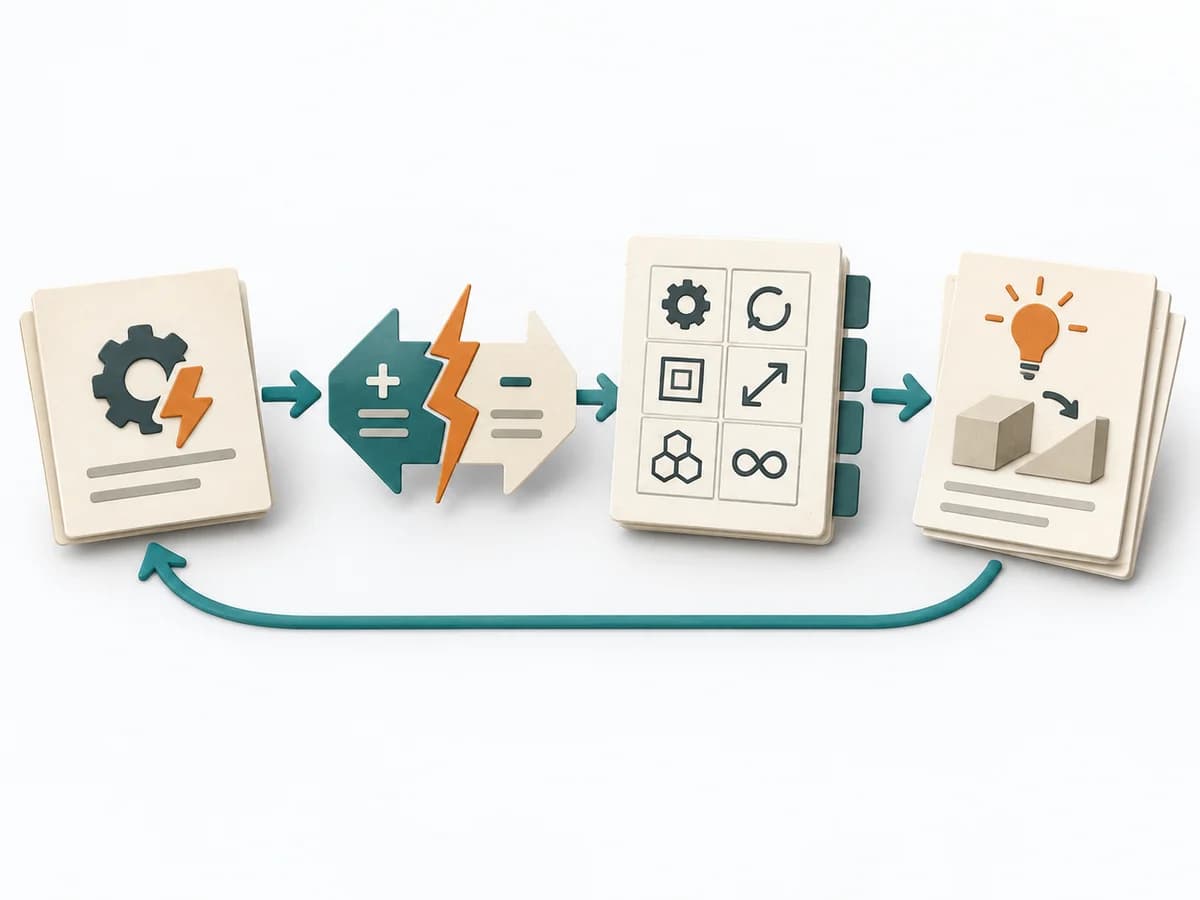 Innovation TRIZ |  Operations Fishbone Diagram |
|---|---|---|---|
Purposedifferent | With a confusing workflow that has many handoffs, the method makes the actual process visible. It shows where work is passed on, delayed, or duplicated, so improvement targets the right spots. | For technical contradictions or trade-offs, the method looks for solutions that resolve opposing requirements at the same time. It translates limits into an explicit picture of conflict that becomes workable. This produces not just compromises but more elegant principles. | When a problem has several possible contributing factors, the method sorts causes by cause areas. It prevents an initial hunch from blocking the view of other plausible drivers. |
Complexitydifferent | Medium | High | Low |
Timedifferent | 1-3 h | 1-4 h | 30-60 min |
Participantsdifferent | 3-10 | 2-8 | 2-8 |
Formatdifferent | Workshop | Workshop + async | Workshop |
Outputdifferent | Process Map, Handoff List, Improvement Backlog | Contradiction Statement, Inventive Principles, Solution Concepts | Fishbone Diagram, Cause Categories, Investigation Backlog |
Tagsno overlap | ProcessOperationsImprovement | InnovationProblem solvingContradictionsCreativity | Root causeQualityOperations |
Often compared together
Methods with strong topical overlap with the current selection, not yet in the comparison.