View methods side by side.
Choose up to four methods. Add them using the search and share the comparison by copying its link.
Selected:Process MappingTeam Topologies Interaction ModesRoot Cause AnalysisFailure Mode and Effects Analysis
| Criterion |  Operations Process Mapping | 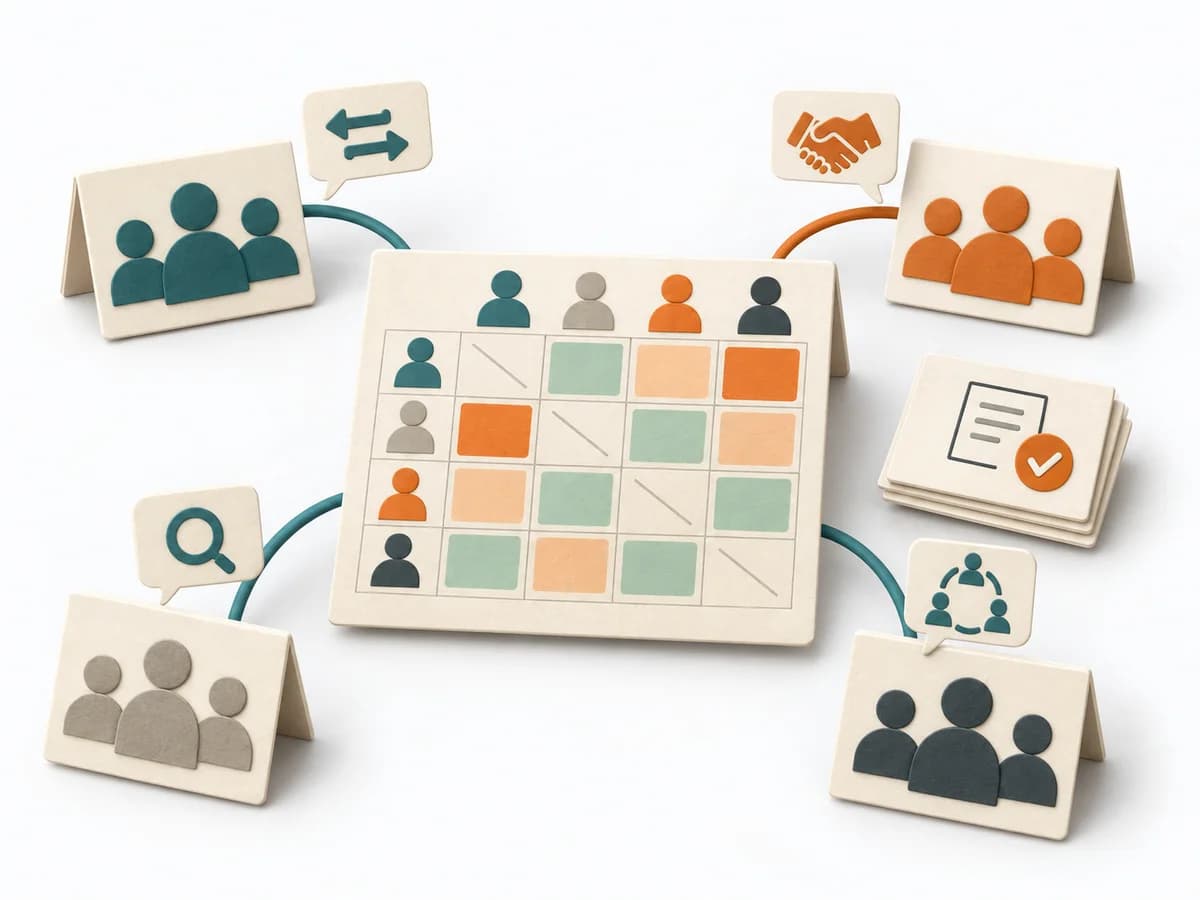 Team Design Team Topologies Interaction Modes |  Operations Root Cause Analysis |  Operations Failure Mode and Effects Analysis |
|---|---|---|---|---|
Purposedifferent | With a confusing workflow that has many handoffs, the method makes the actual process visible. It shows where work is passed on, delayed, or duplicated, so improvement targets the right spots. | When several teams collaborate repeatedly, it describes the right interaction mode for each interface between them. It clarifies responsibility, interaction, and load between teams. The result is captured as an interaction heat map and pairwise agreements. | When a problem keeps recurring and the cause stays unclear, the method exposes the underlying mechanism. It separates symptom, guess, and robust explanation from one another. | For a process, product, or service with noticeable failure risks, the method assesses possible failure modes in advance. It directs attention to combinations of occurrence, effect, and detectability. |
Complexitydifferent | Medium | Medium | Medium | High |
Timedifferent | 1-3 h | Half day | 1-4 h | 2-6 h |
Participantsdifferent | 3-10 | Team-Leads plus Architecture | 3-8 | 3-10 |
Formatdifferent | Workshop | Workshop | Workshop + async | Workshop |
Outputdifferent | Process Map, Handoff List, Improvement Backlog | Interaction Heat Map, Agreements per Pair | Problem Statement, Cause Hypotheses, Confirmed Causes, Action Plan | FMEA Table, Risk Priority, Mitigation Actions |
Tagsno overlap | ProcessOperationsImprovement | TeamAlignmentCollaborationOrganization | Root causeProblem solvingQualityIncident | RiskQualityOperationsRoot cause |