View methods side by side.
Choose up to four methods. Add them using the search and share the comparison by copying its link.
| Criterion |  Operations Process Mapping | 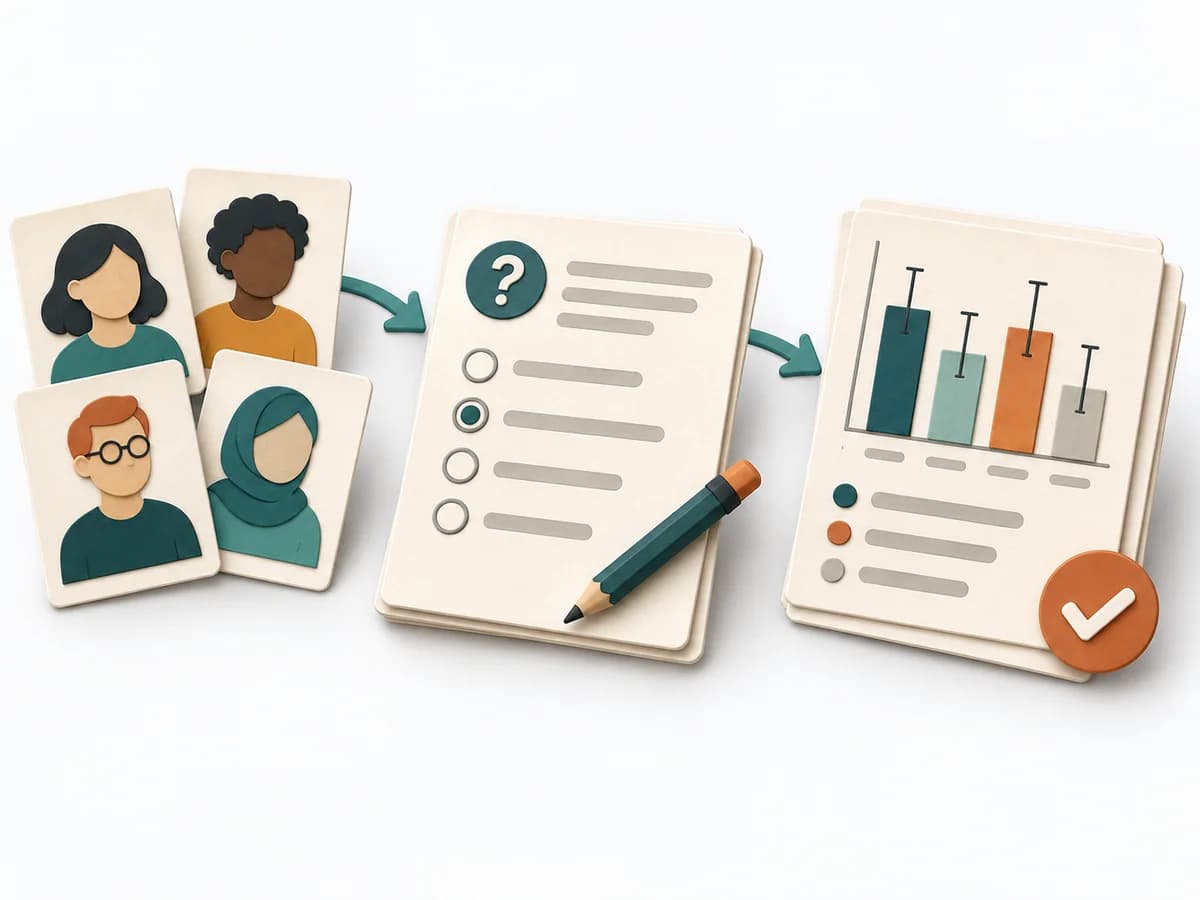 UX Research Surveys |  Operations A3 Problem Solving | 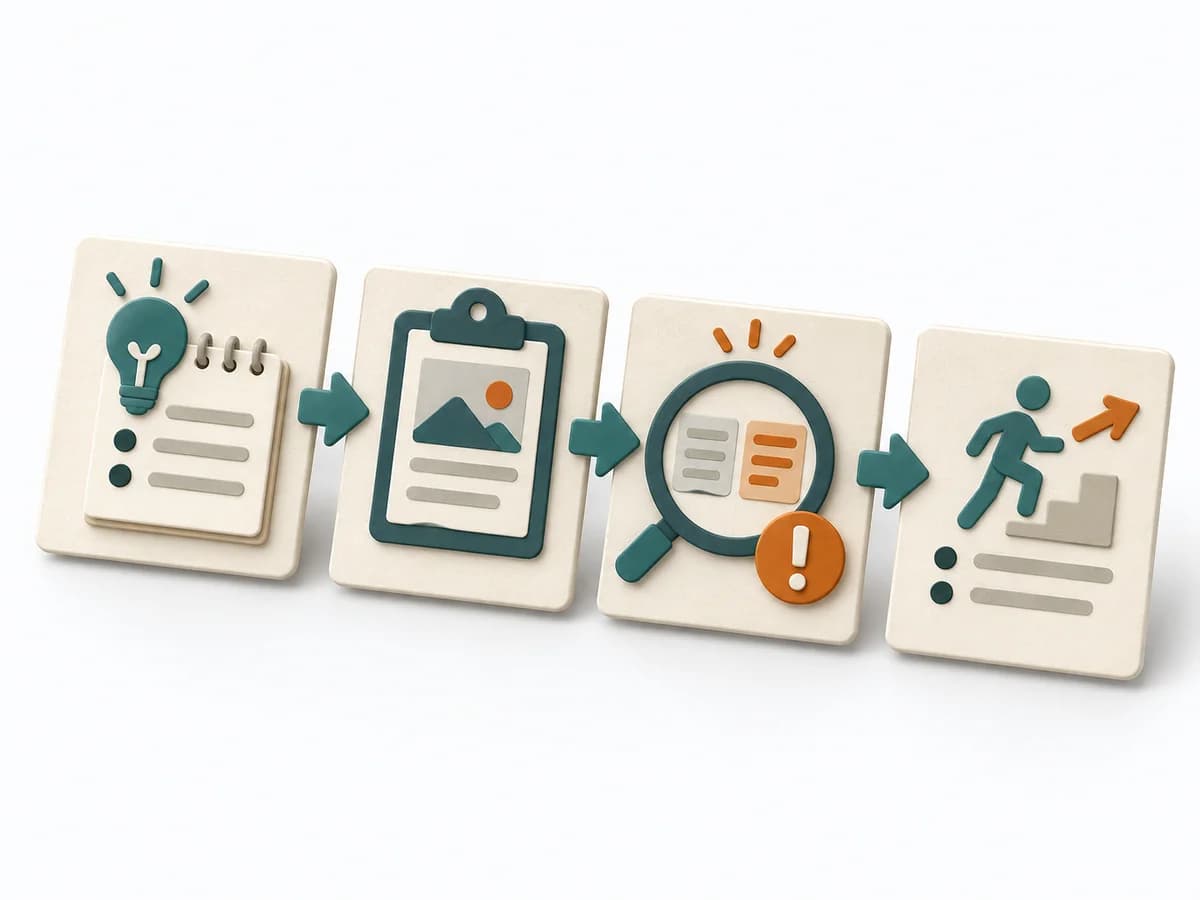 Operations After-Action Review |
|---|---|---|---|---|
Purposedifferent | With a confusing workflow that has many handoffs, the method makes the actual process visible. It shows where work is passed on, delayed, or duplicated, so improvement targets the right spots. | When a topic needs to be validated broadly and many people can answer the same question, surveys gather structured feedback in a scalable form. Answers become comparable and segmentable instead of remaining merely anecdotal. | For a complex deviation with several people involved, the method bundles problem, analysis, and decision onto one page. It creates a shared working space where causes, countermeasures, and follow-up fit together. | After missions or project phases with unclear outcomes, the method makes visible what actually happened and what can be learned from it. It separates course, effect, and causes so experience turns into solid improvement. |
Complexitydifferent | Medium | Medium | Medium | Low |
Timedifferent | 1-3 h | 3-14 Tage | 45-90 min | 20-45 min |
Participantsdifferent | 3-10 | 50+ | 2-5 | 3-12 |
Formatdifferent | Workshop | Async | Workshop + async | Workshop + async |
Outputdifferent | Process Map, Handoff List, Improvement Backlog | Survey Results, Charts, Segment Insights | A3 Report, Action Plan, Root Cause Analysis | Lessons learned, Action items, Event summary |
Tagsno overlap | ProcessOperationsImprovement | QuantitativeResearchValidation | LeanProblem solvingCoachingOperations | LearningOperationsImprovement |