View methods side by side.
Choose up to four methods. Add them using the search and share the comparison by copying its link.
| Criterion | 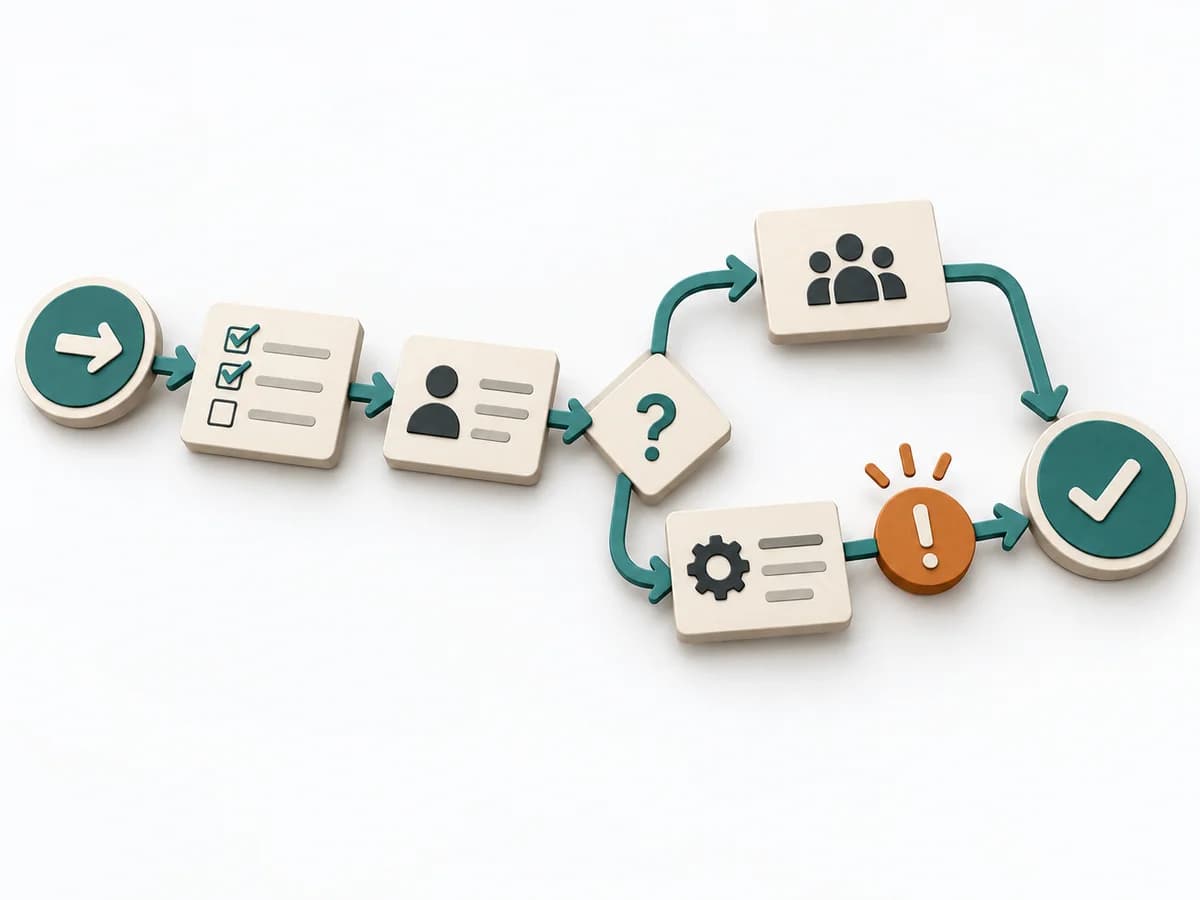 Operations Process Mapping |  Agile Planning Poker | 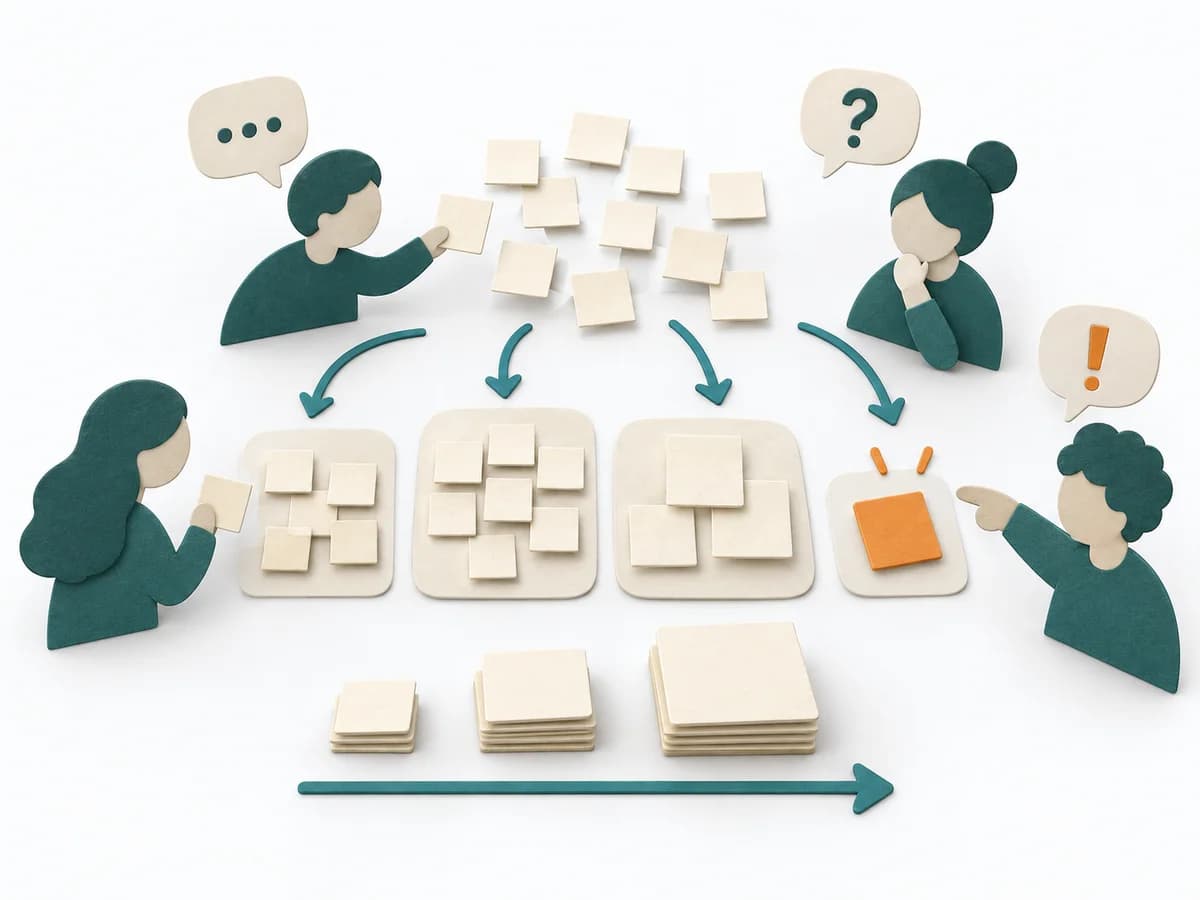 Agile Affinity Estimation |  Operations After-Action Review |
|---|---|---|---|---|
Purposedifferent | With a confusing workflow that has many handoffs, the method makes the actual process visible. It shows where work is passed on, delayed, or duplicated, so improvement targets the right spots. | When estimates within the team diverge too much, it puts differing expectations on a common test bench. It separates rough complexity from unspoken assumptions. | When many tasks need to be classified quickly, it sorts them by perceived effort and similarity. It reduces the effort of fine-grained estimation for large volumes. | After missions or project phases with unclear outcomes, the method makes visible what actually happened and what can be learned from it. It separates course, effect, and causes so experience turns into solid improvement. |
Complexitydifferent | Medium | Low | Medium | Low |
Timedifferent | 1-3 h | 2-5 min je Item | 30-90 min | 20-45 min |
Participantsdifferent | 3-10 | 3-9 | 3-12 | 3-12 |
Formatdifferent | Workshop | Workshop + async | Workshop | Workshop + async |
Outputdifferent | Process Map, Handoff List, Improvement Backlog | Relative Estimates, Assumption Notes, Split Candidates | Affinity Size Map, Grouped Estimates, Unclear Items | Lessons learned, Action items, Event summary |
Tagsno overlap | ProcessOperationsImprovement | EstimationAgileRelative sizingTeam | EstimationBacklogRelative sizing | LearningOperationsImprovement |