View methods side by side.
Choose up to four methods. Add them using the search and share the comparison by copying its link.
| Criterion | 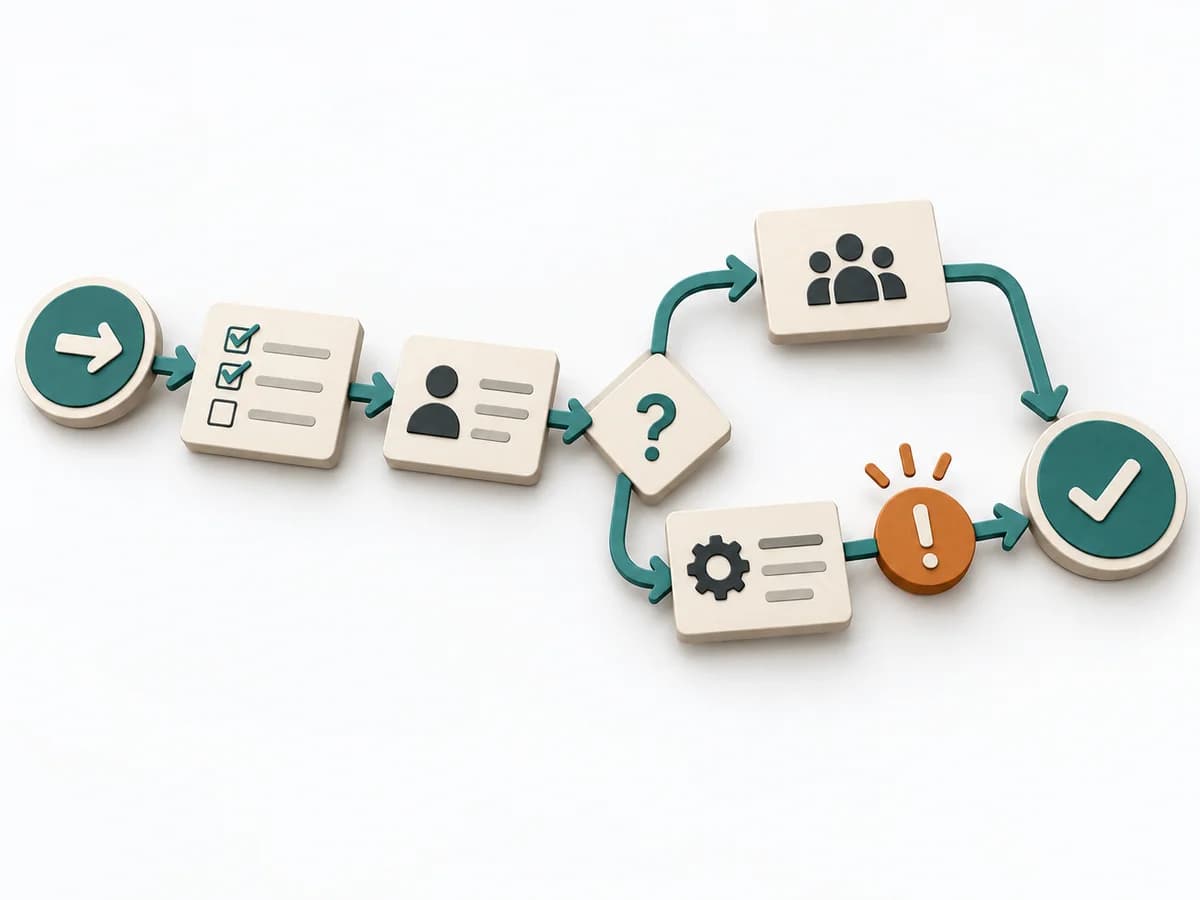 Operations Process Mapping | 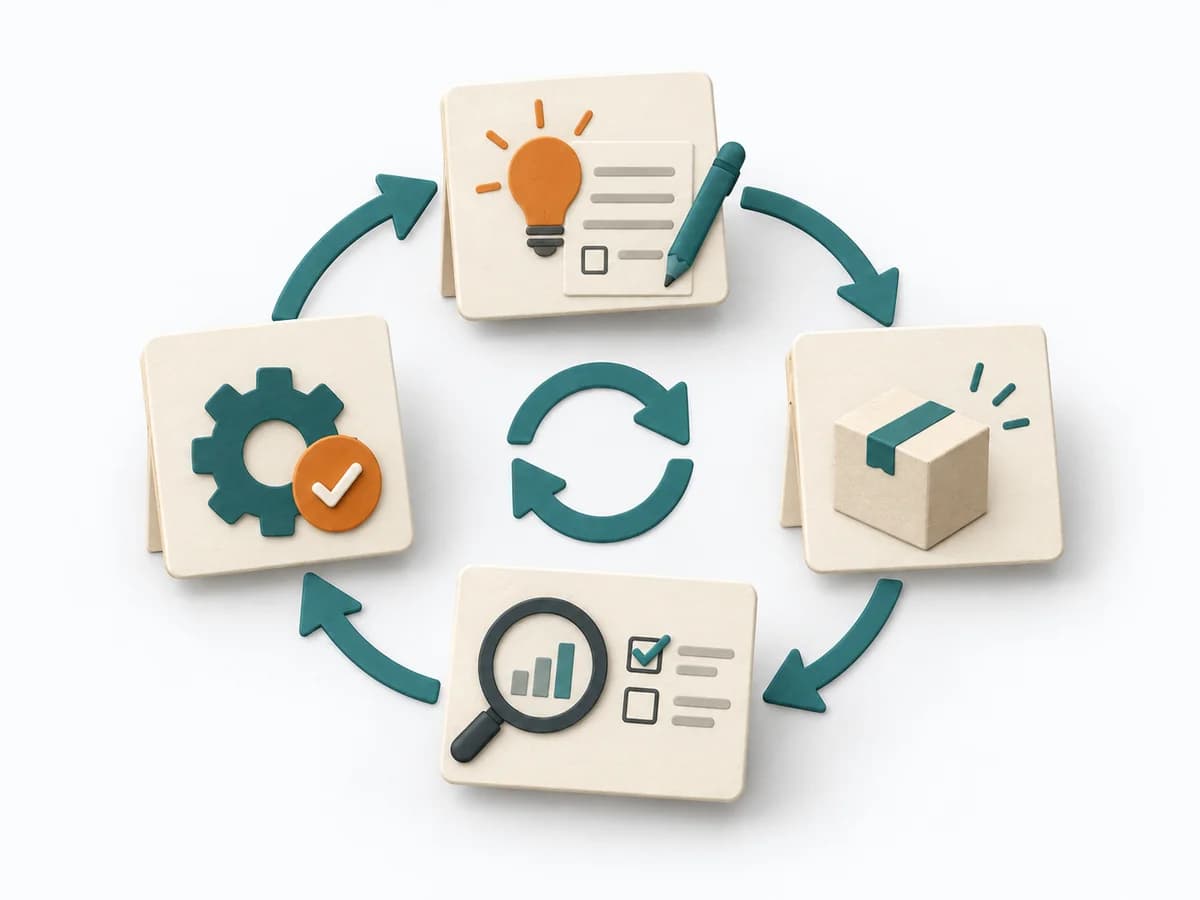 Operations PDCA Cycle |  Growth A/B Testing | 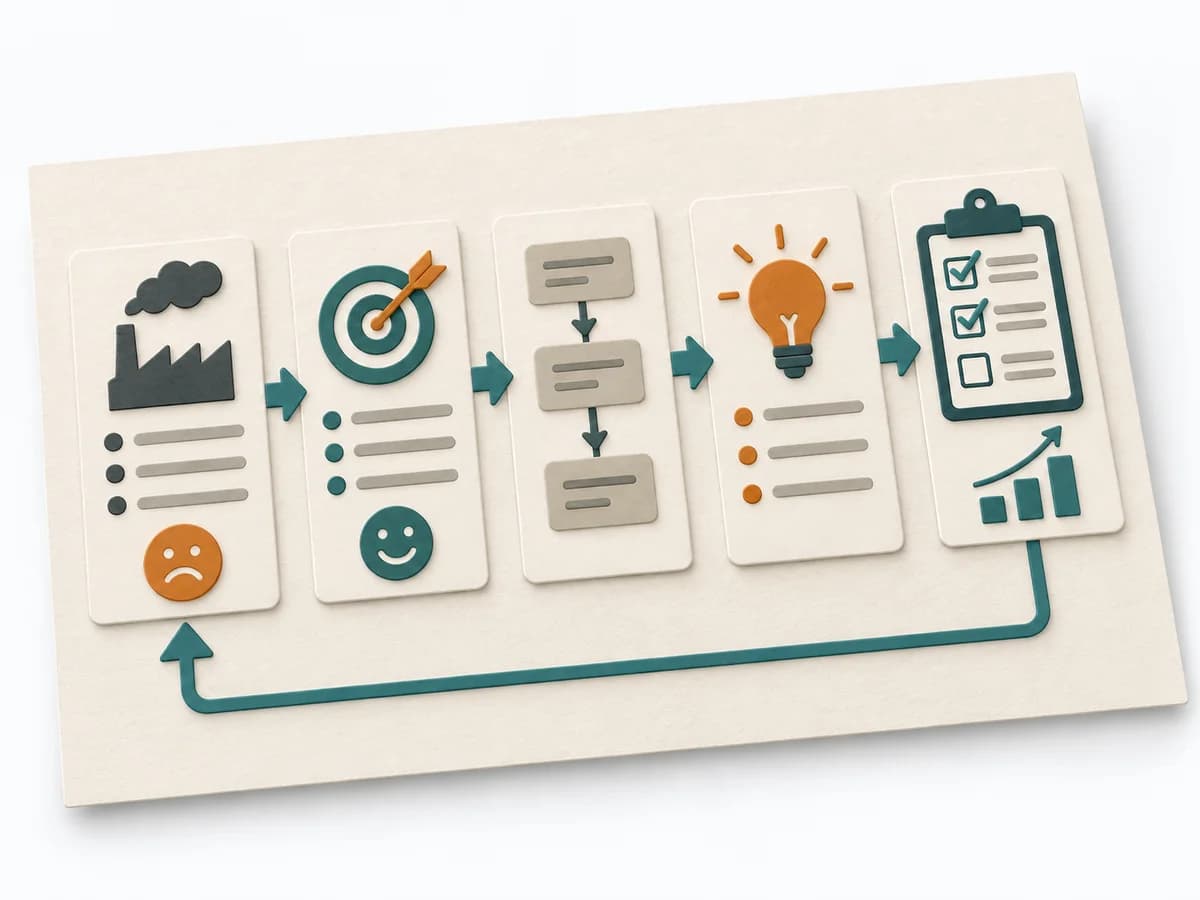 Operations A3 Problem Solving |
|---|---|---|---|---|
Purposedifferent | With a confusing workflow that has many handoffs, the method makes the actual process visible. It shows where work is passed on, delayed, or duplicated, so improvement targets the right spots. | For an improvement that still has to prove itself in everyday work, the method runs it through small learning loops. It connects planning, checking, and standardization into a repeatable learning mode. | When two variants compete, discussions quickly decide by taste rather than effect. A/B Testing checks behavior under controlled conditions and separates real improvement from chance or expectation effects. | For a complex deviation with several people involved, the method bundles problem, analysis, and decision onto one page. It creates a shared working space where causes, countermeasures, and follow-up fit together. |
Complexitydifferent | Medium | Low | High | Medium |
Timedifferent | 1-3 h | 1 h bis mehrere Wochen | 1-4 Wochen | 45-90 min |
Participantsdifferent | 3-10 | 1-8 | 1-6 | 2-5 |
Formatdifferent | Workshop | Workshop + async | Async | Workshop + async |
Outputdifferent | Process Map, Handoff List, Improvement Backlog | PDCA Log, Experiment Plan, Learning Outcome, Standard Change | Experiment results, Decision log, Learning summary | A3 Report, Action Plan, Root Cause Analysis |
Tagsno overlap | ProcessOperationsImprovement | Continuous improvementLeanExperiments | ExperimentsGrowthAnalyticsValidation | LeanProblem solvingCoachingOperations |