View methods side by side.
Choose up to four methods. Add them using the search and share the comparison by copying its link.
| Criterion |  Operations Process Mapping | 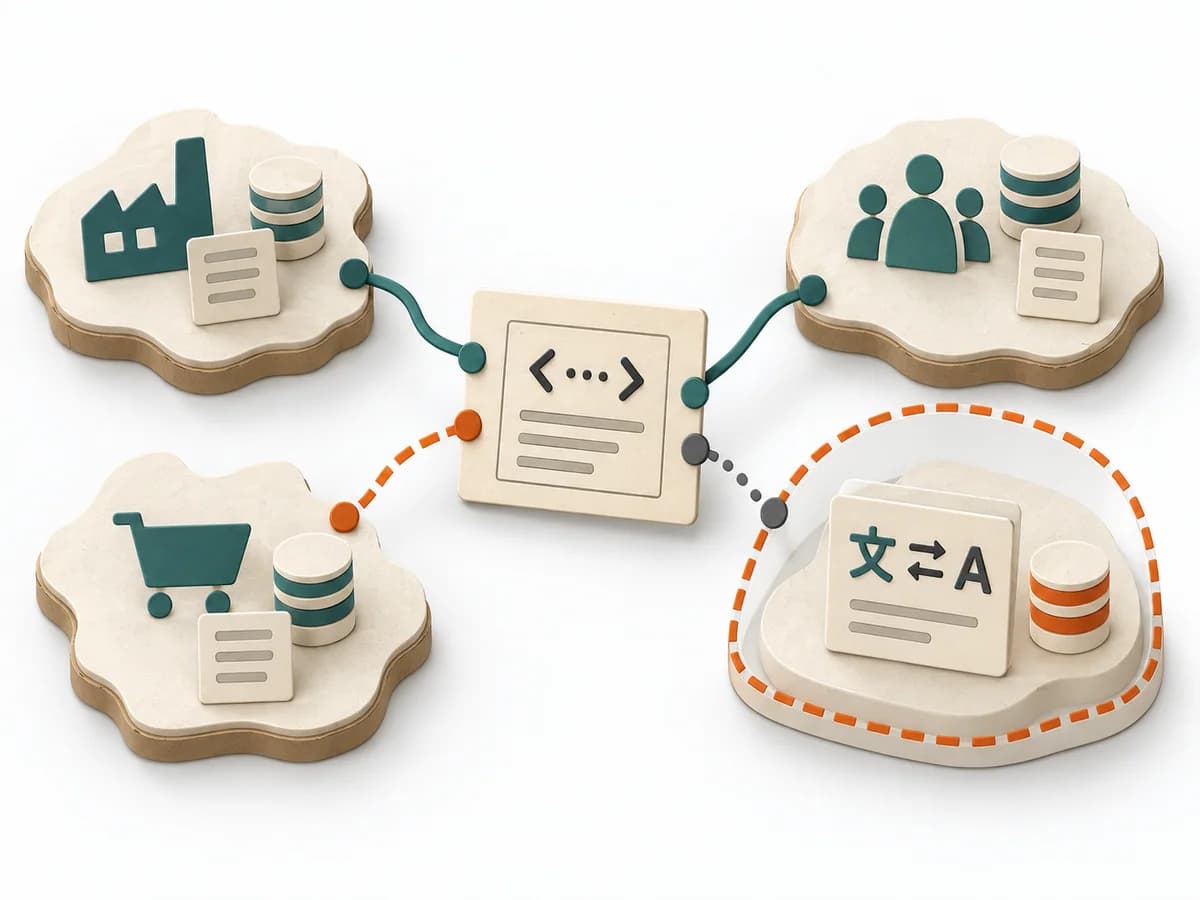 Domain Modeling Context Map | 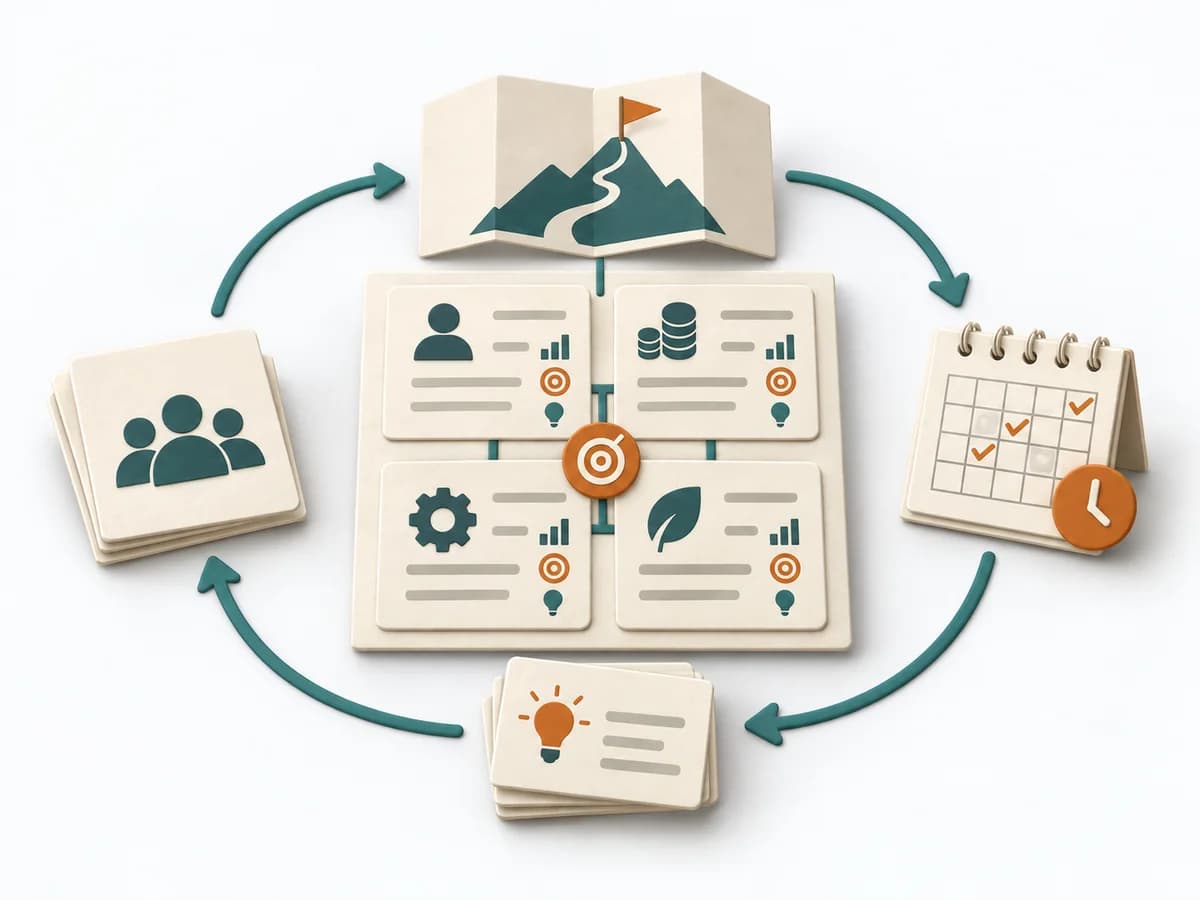 Business Strategy Balanced Scorecard |  Operations After-Action Review |
|---|---|---|---|---|
Purposedifferent | With a confusing workflow that has many handoffs, the method makes the actual process visible. It shows where work is passed on, delayed, or duplicated, so improvement targets the right spots. | When several contexts need to talk to each other, it makes their relationships and dependencies legible. It helps sort integration pressure and responsibilities across system boundaries. | Balanced Scorecard translates strategy into a few interconnected perspectives and metrics. It holds impact, steering, and learning together in daily work instead of narrowing strategy down to financial figures. | After missions or project phases with unclear outcomes, the method makes visible what actually happened and what can be learned from it. It separates course, effect, and causes so experience turns into solid improvement. |
Complexitydifferent | Medium | Medium | High | Low |
Timedifferent | 1-3 h | 1-3 h | Halber Tag bis mehrere Wochen | 20-45 min |
Participantsdifferent | 3-10 | 2-8 | 4-12 | 3-12 |
Formatdifferent | Workshop | Workshop + async | Workshop + async | Workshop + async |
Outputdifferent | Process Map, Handoff List, Improvement Backlog | Context Map, Integration Patterns, Boundary Notes | Balanced Scorecard, Strategic Measures, Initiative Map | Lessons learned, Action items, Event summary |
Tagsno overlap | ProcessOperationsImprovement | Domain-Driven DesignBoundariesStrategy | StrategyMetricsExecution | LearningOperationsImprovement |