View methods side by side.
Choose up to four methods. Add them using the search and share the comparison by copying its link.
| Criterion | 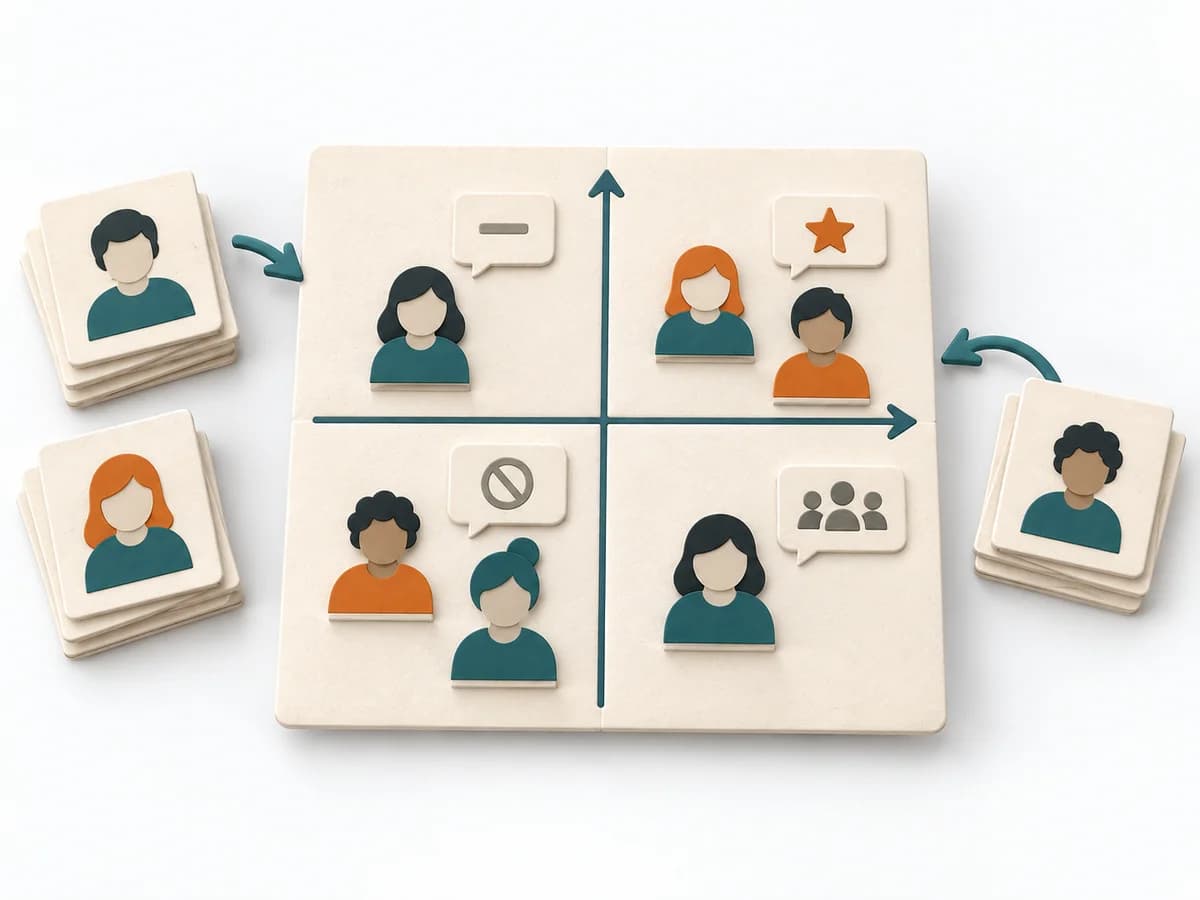 Facilitation Power Interest Grid |  Facilitation Stakeholder Mapping | 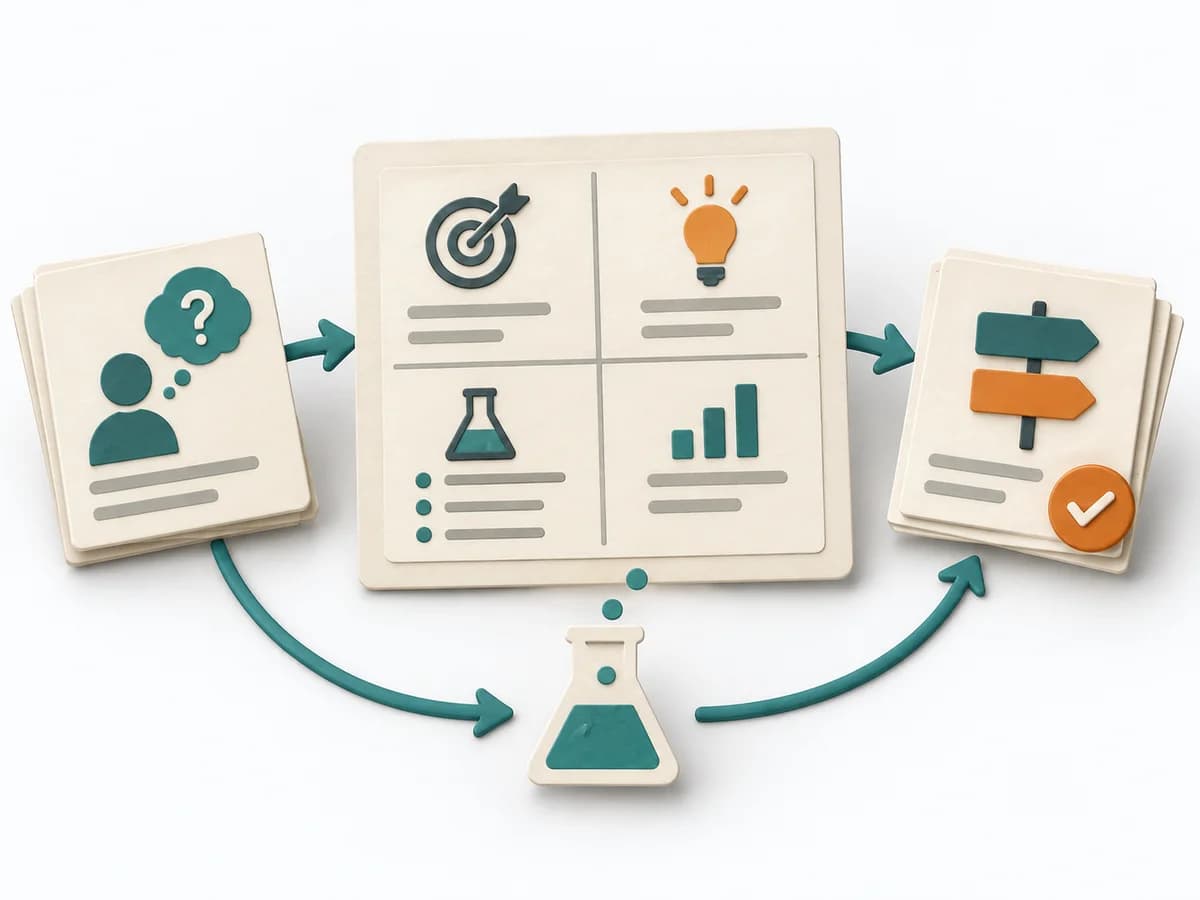 Product Discovery Experiment Canvas | 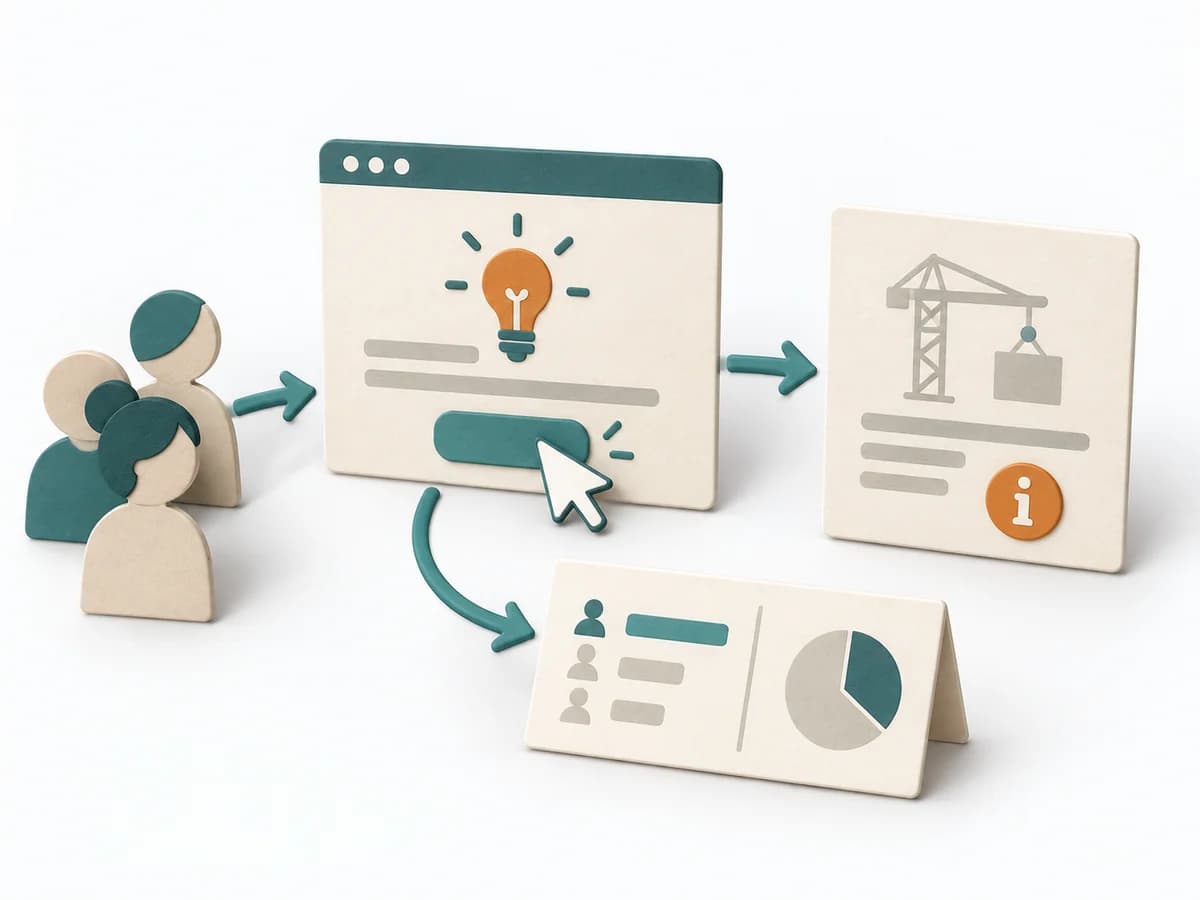 Product Discovery Fake Door Test |
|---|---|---|---|---|
Purposedifferent | When many stakeholders compete for attention at once, the Power Interest Grid sorts them by influence and stake. It turns individual contributions into a visible selection. The result is captured as a Power Interest Grid and a stakeholder-specific strategy. | When an initiative depends on many people, interests, and power dynamics, Stakeholder Mapping systematically orders the environment. It shows who influences, who is affected, and where relationship management or safeguarding matters first. | When experiments become unreadable after the fact, it arranges hypothesis, signal, and learning goal on a single canvas. It separates problem, assumption, solution, and evidence. The result is captured as a Completed Experiment Canvas and a Success Metric. | When demand is still unclear, it measures interest in a feature before it is built. It separates real behavior from polite agreement and deliberately keeps build effort small. |
Complexitydifferent | Low | Low | Low | Medium |
Timedifferent | 30-60 min | 60–90 min | 30-60 min | 1-5 Tage |
Participantsdifferent | 2-8 | 2-8 | 1-5 | Nutzertraffic |
Formatdifferent | Workshop | Workshop + async | Workshop + async | Async |
Outputdifferent | Power Interest Grid, Strategy per Stakeholder | Stakeholder Map, Engagement Plan, Risk Notes | Completed Experiment Canvas, Success Metric | Click Data, Interest Signal, Learning Decision |
Tagsno overlap | StakeholdersFacilitationAlignmentPlanning | StakeholdersAlignmentFacilitationChange | ExperimentsValidationDiscoveryHypothesis | ValidationExperimentsDemandDiscovery |