View methods side by side.
Choose up to four methods. Add them using the search and share the comparison by copying its link.
| Criterion | 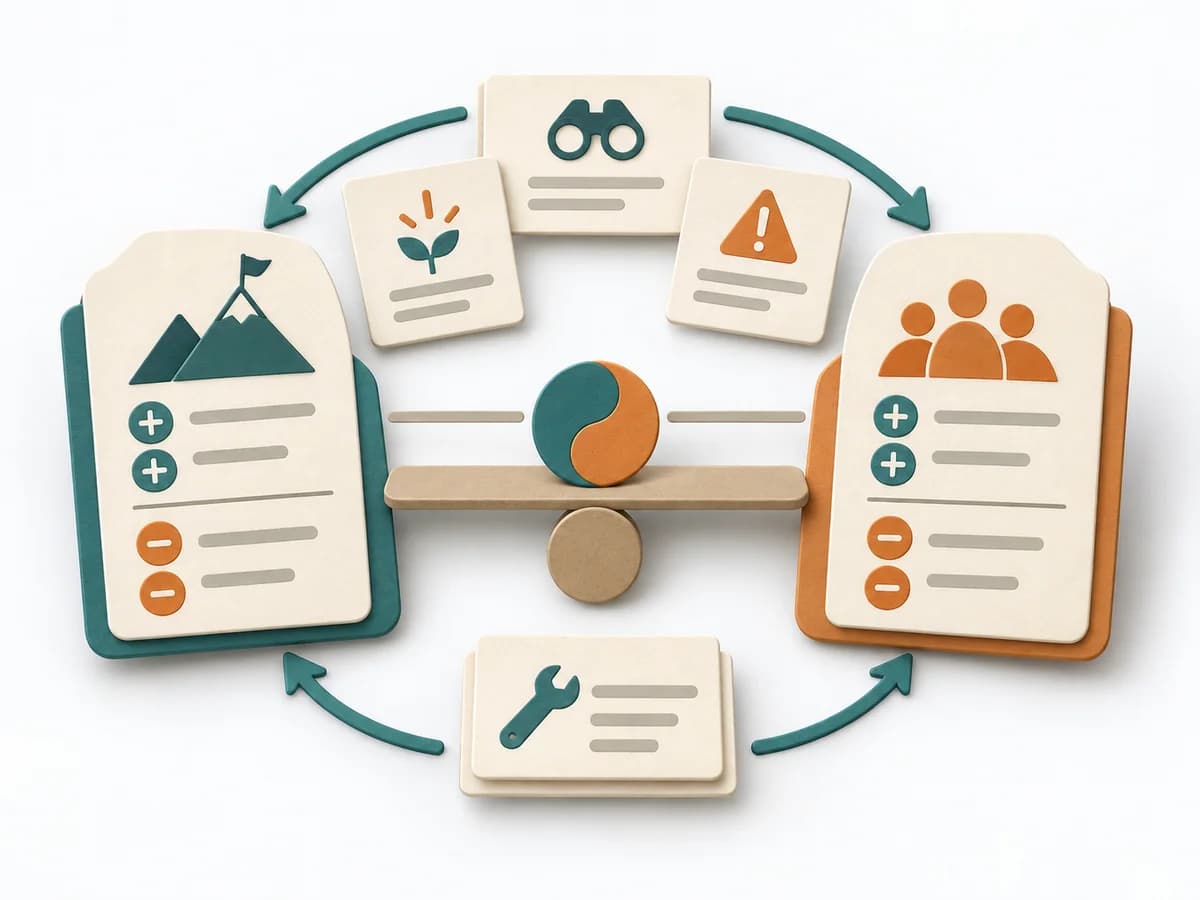 Systems Thinking Polarity Mapping |  Systems Thinking Wardley Mapping | 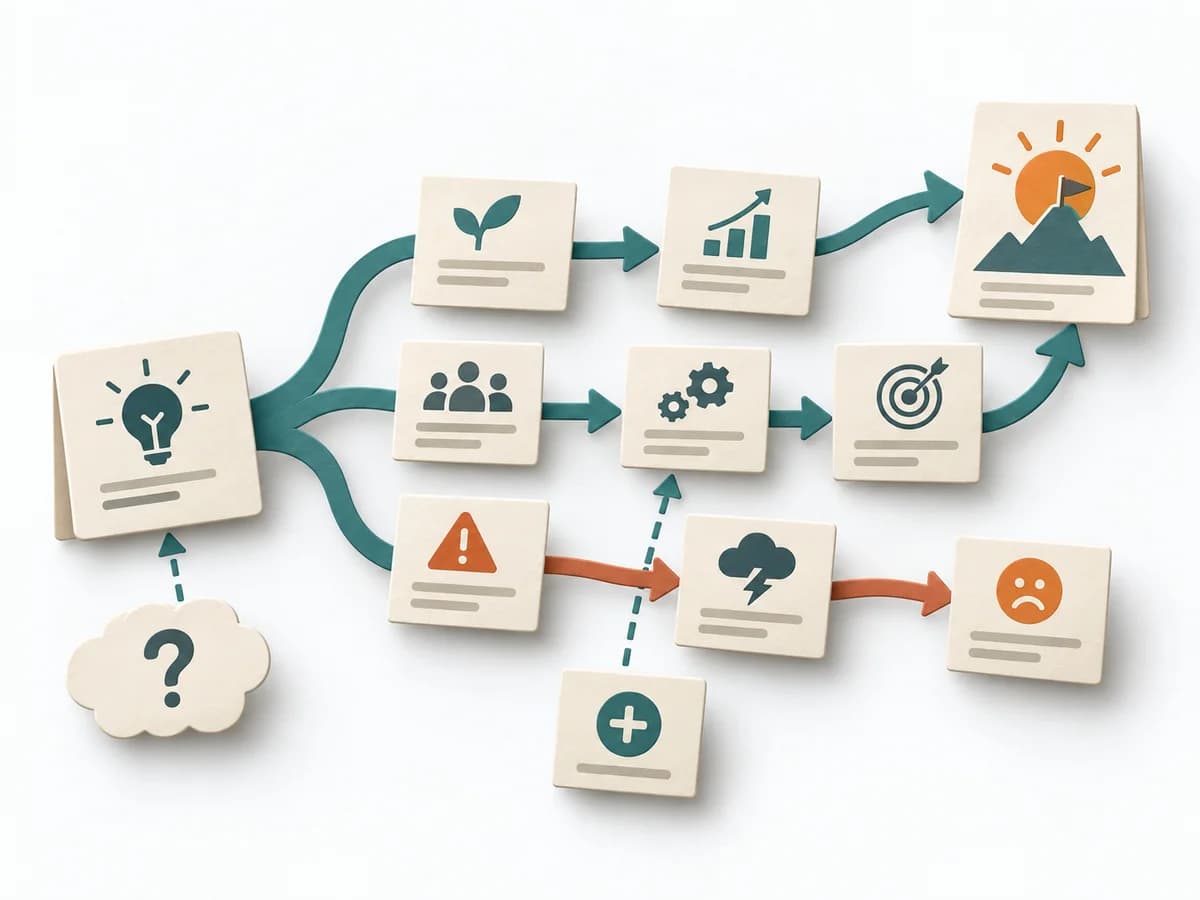 Systems Thinking Future Reality Tree |  Systems Thinking Behavior Over Time Graph |
|---|---|---|---|---|
Purposedifferent | Polarity Mapping makes tensions between two opposing poles tangible, such as standardization and adaptation or control and autonomy. The method guards against making apparent either-or decisions prematurely. | Wardley Mapping makes visible where an offering stands today and where it can evolve. The method connects user need, value chain, and evolution stages into a strategic basis for platform, build, or buy decisions. | A Future Reality Tree shows how desired actions are meant to lead to a better system state. The method checks whether a path of change holds together logically before time flows into implementation. | A Behavior Over Time Graph shows how a metric or observation develops over time. The method makes trends, breaks, and recurring patterns visible that get lost in snapshots. |
Complexitydifferent | Medium | Medium | High | Low |
Timedifferent | 1-2 h | 1-3 h | 2-4 h | 20-45 min |
Participantsdifferent | 3-12 | 2-10 | 3-8 | 1-10 |
Formatdifferent | Workshop | Workshop + async | Workshop | Workshop + async |
Outputdifferent | Polarity Map, Warning Signs, Balance Actions | Wardley Map, Strategic Options, Evolution Notes | Future Reality Tree, Negative Branches, Assumption List, Improved Injections | Behavior Over Time Graph, Trend Hypotheses, Key Events |
Tags1 shared | Systems thinkingTradeoffsLeadership | StrategySystems thinkingDynamics | Theory of ConstraintsSystems thinkingChange | Systems thinkingPatternsDynamics |