View methods side by side.
Choose up to four methods. Add them using the search and share the comparison by copying its link.
| Criterion | 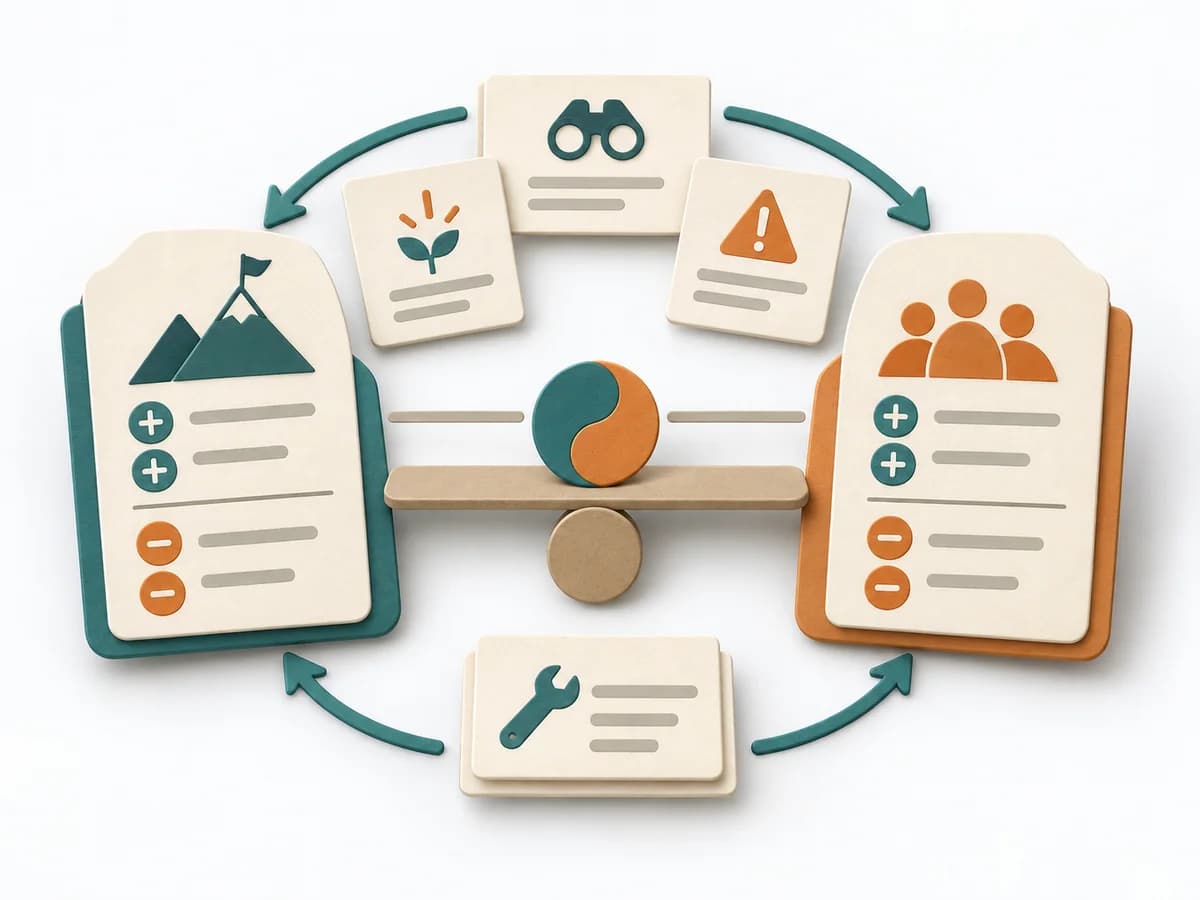 Systems Thinking Polarity Mapping | 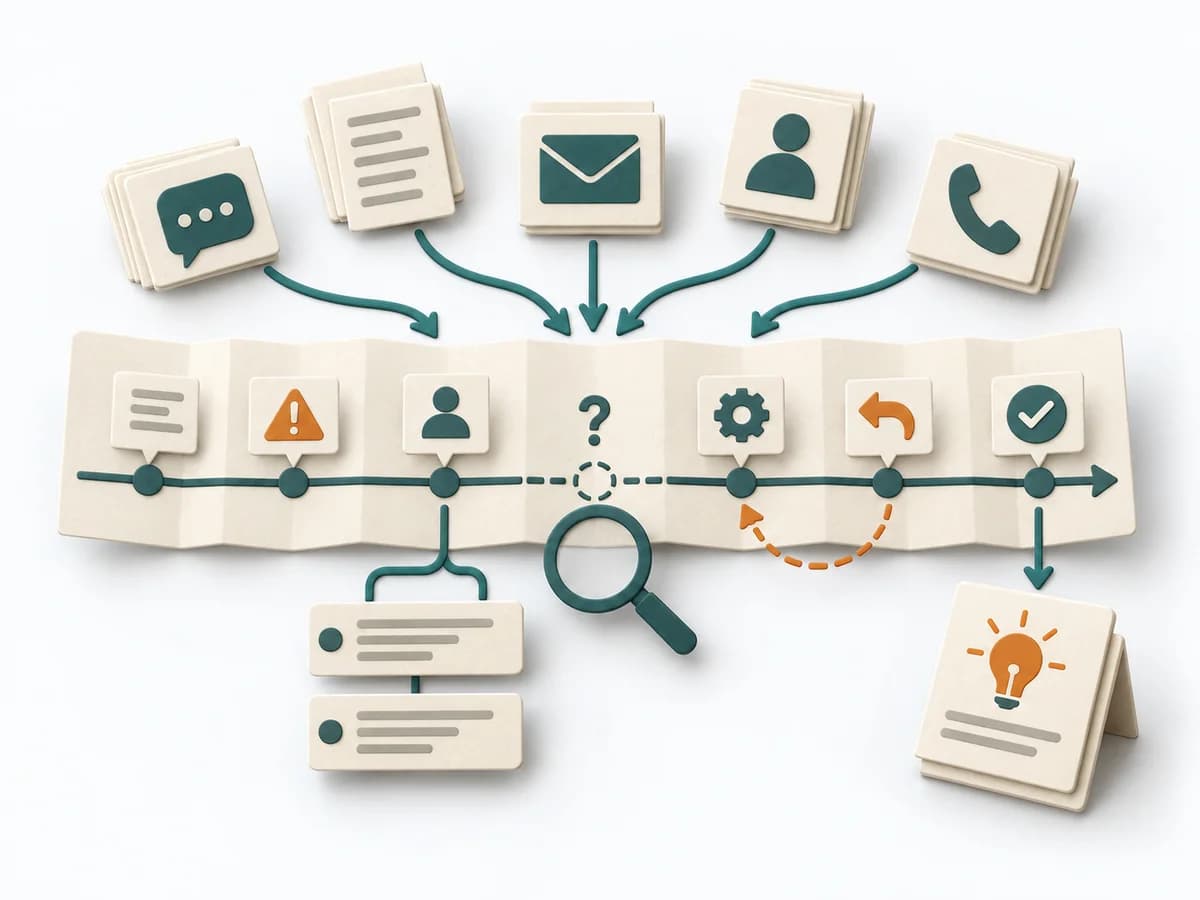 DevOps Incident Timeline Analysis | 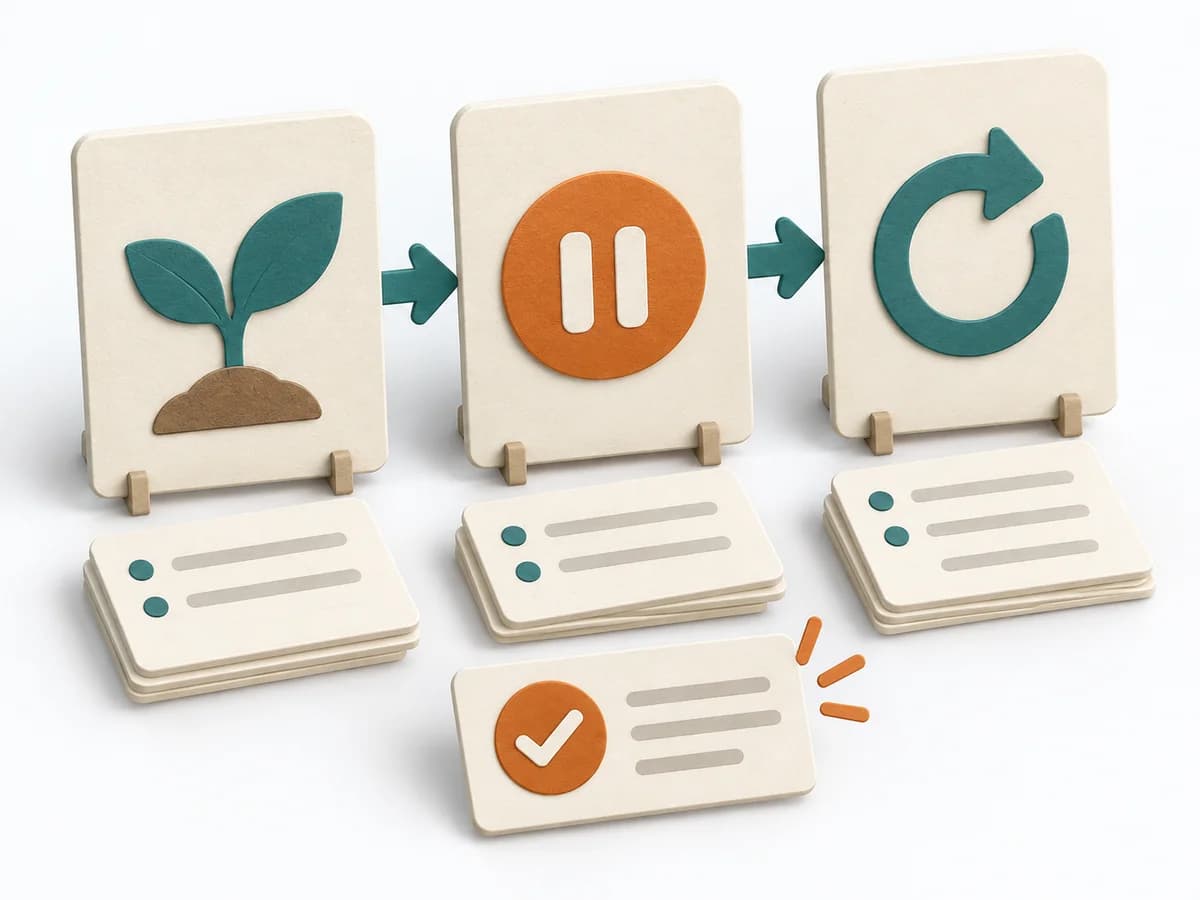 Agile Start Stop Continue | 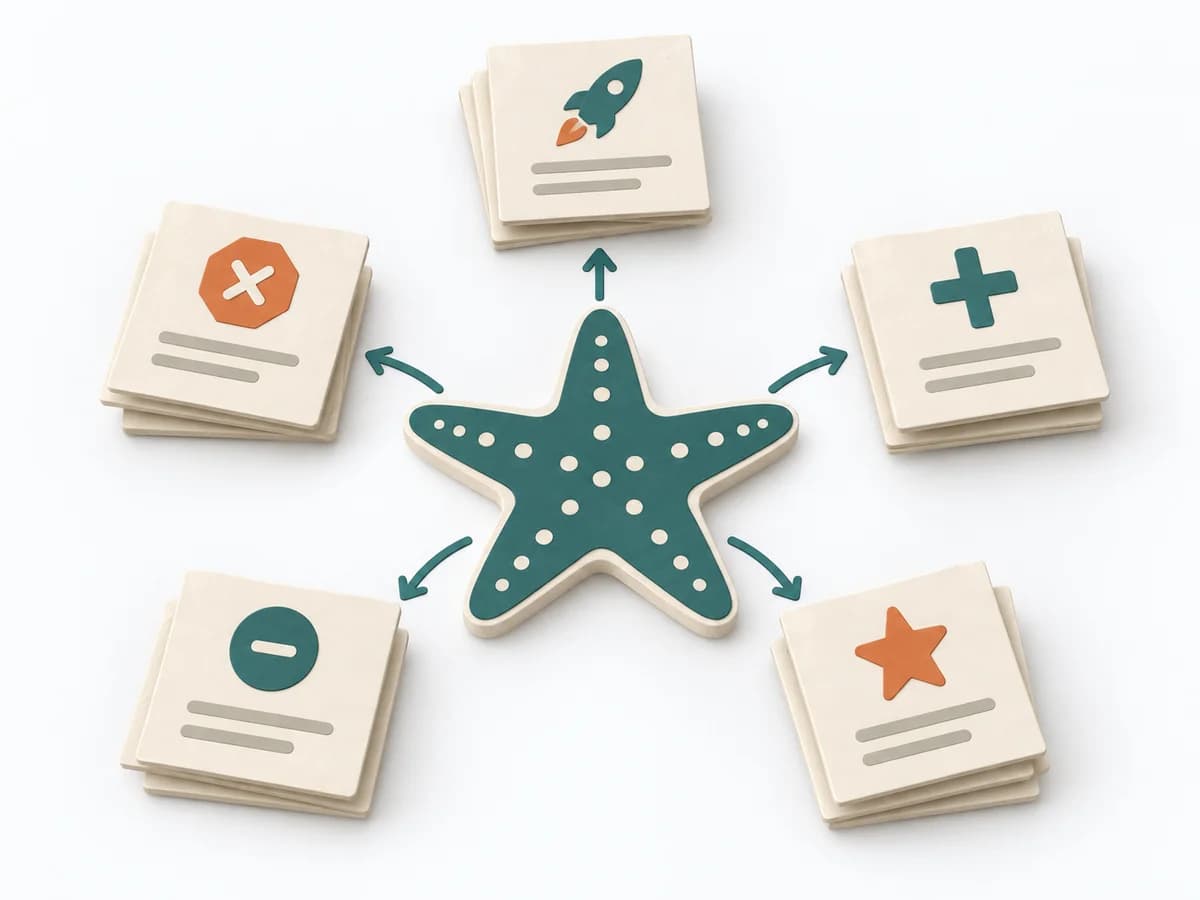 Agile Starfish Retrospective |
|---|---|---|---|---|
Purposedifferent | Polarity Mapping makes tensions between two opposing poles tangible, such as standardization and adaptation or control and autonomy. The method guards against making apparent either-or decisions prematurely. | For an incident with an unclear sequence, the method makes the timeline precisely visible. It separates perception, reaction, and delay so cause and effect become more clearly readable. | When a team wants to deliberately adjust its working behavior, it makes habits visible and assessable. It focuses on concrete changes instead of diffuse mood. | When improvement options need to be sorted more finely than just start and stop, it brings observations into clear kinds of action. This makes visible what should be done more, less, newly, or continued. |
Complexitydifferent | Medium | Medium | Low | Low |
Timedifferent | 1-2 h | 60-180 min | 30-60 min | 45-90 min |
Participantsdifferent | 3-12 | 3-10 | 3-12 | 4-12 |
Formatdifferent | Workshop | Workshop + async | Workshop | Workshop |
Outputdifferent | Polarity Map, Warning Signs, Balance Actions | Incident Timeline, Evidence Log, Delay Analysis, Improvement Actions | Start Stop Continue Board, Improvement Actions | Starfish Board, Practice Changes, Experiments |
Tagsno overlap | Systems thinkingTradeoffsLeadership | IncidentTimelineSite Reliability Engineering | RetrospectiveImprovementTeamReflection | RetrospectiveImprovementExperimentsTeam |