View methods side by side.
Choose up to four methods. Add them using the search and share the comparison by copying its link.
| Criterion | 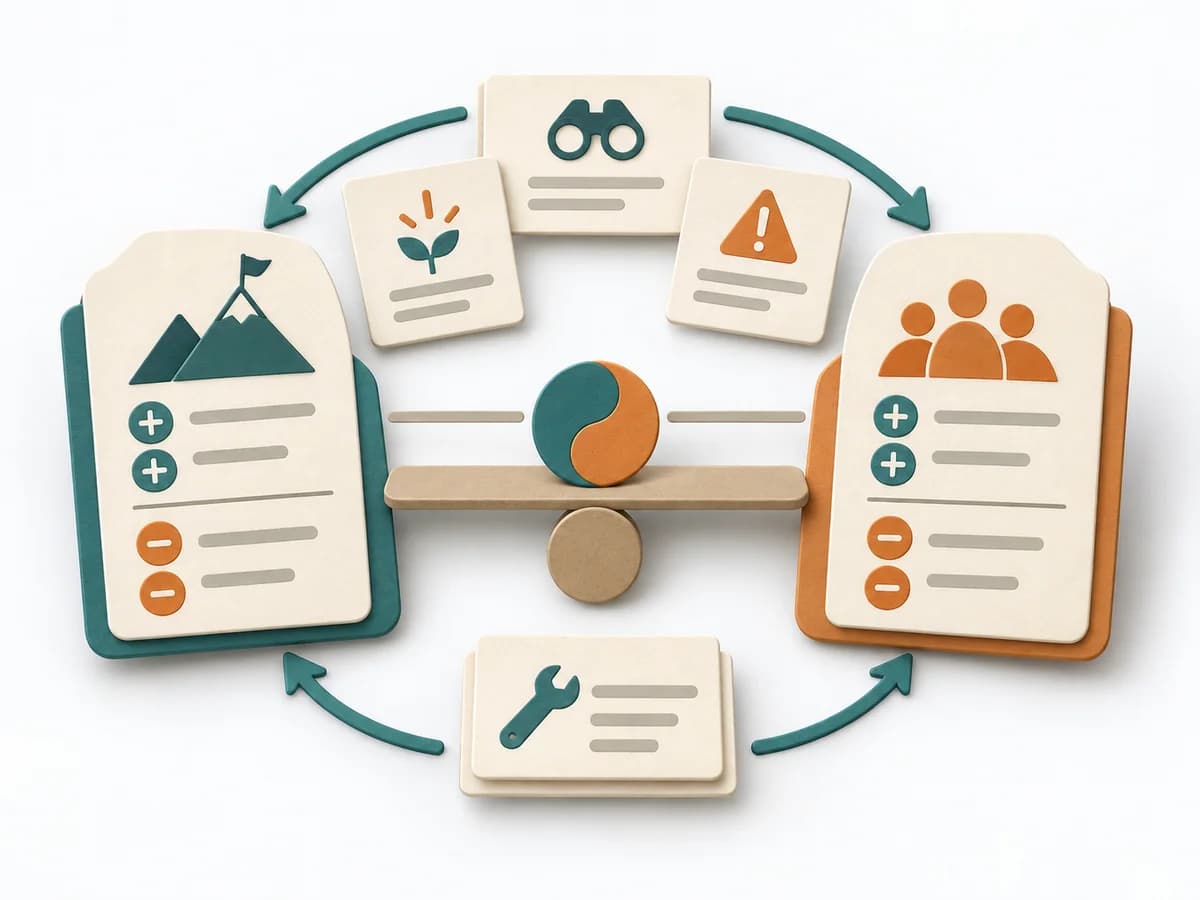 Systems Thinking Polarity Mapping |  Growth Funnel Analysis |  Product Discovery Smoke Test | 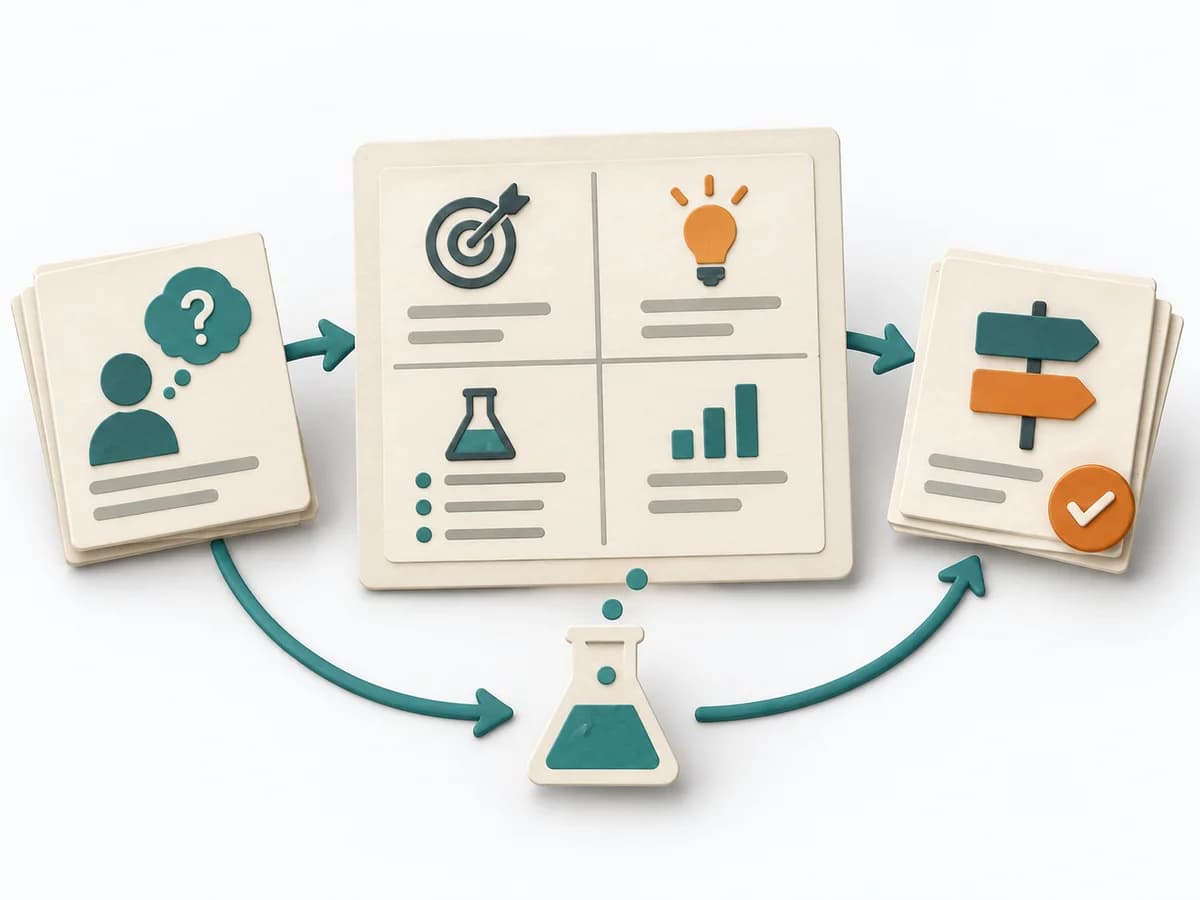 Product Discovery Experiment Canvas |
|---|---|---|---|---|
Purposedifferent | Polarity Mapping makes tensions between two opposing poles tangible, such as standardization and adaptation or control and autonomy. The method guards against making apparent either-or decisions prematurely. | When many visitors or users drop off along the way, the reason behind the number often stays hidden. Funnel Analysis exposes these transitions and makes visible exactly where the path collapses. | When demand only needs to be roughly verified, it tests interest with minimal effort. It measures whether people would take a next step at all. | When experiments become unreadable after the fact, it arranges hypothesis, signal, and learning goal on a single canvas. It separates problem, assumption, solution, and evidence. The result is captured as a Completed Experiment Canvas and a Success Metric. |
Complexitydifferent | Medium | Medium | Low | Low |
Timedifferent | 1-2 h | 1-3 h | 1-5 Tage | 30-60 min |
Participantsdifferent | 3-12 | 1-5 | Nutzertraffic | 1-5 |
Formatdifferent | Workshop | Async | Async | Workshop + async |
Outputdifferent | Polarity Map, Warning Signs, Balance Actions | Funnel report, Drop-off analysis, Optimization hypotheses | Interest Metrics, Conversion Signal, Learning Note | Completed Experiment Canvas, Success Metric |
Tagsno overlap | Systems thinkingTradeoffsLeadership | AnalyticsConversionGrowth | ValidationExperimentsDemandGrowth | ExperimentsValidationDiscoveryHypothesis |