View methods side by side.
Choose up to four methods. Add them using the search and share the comparison by copying its link.
| Criterion |  Business Strategy PESTLE Analysis | 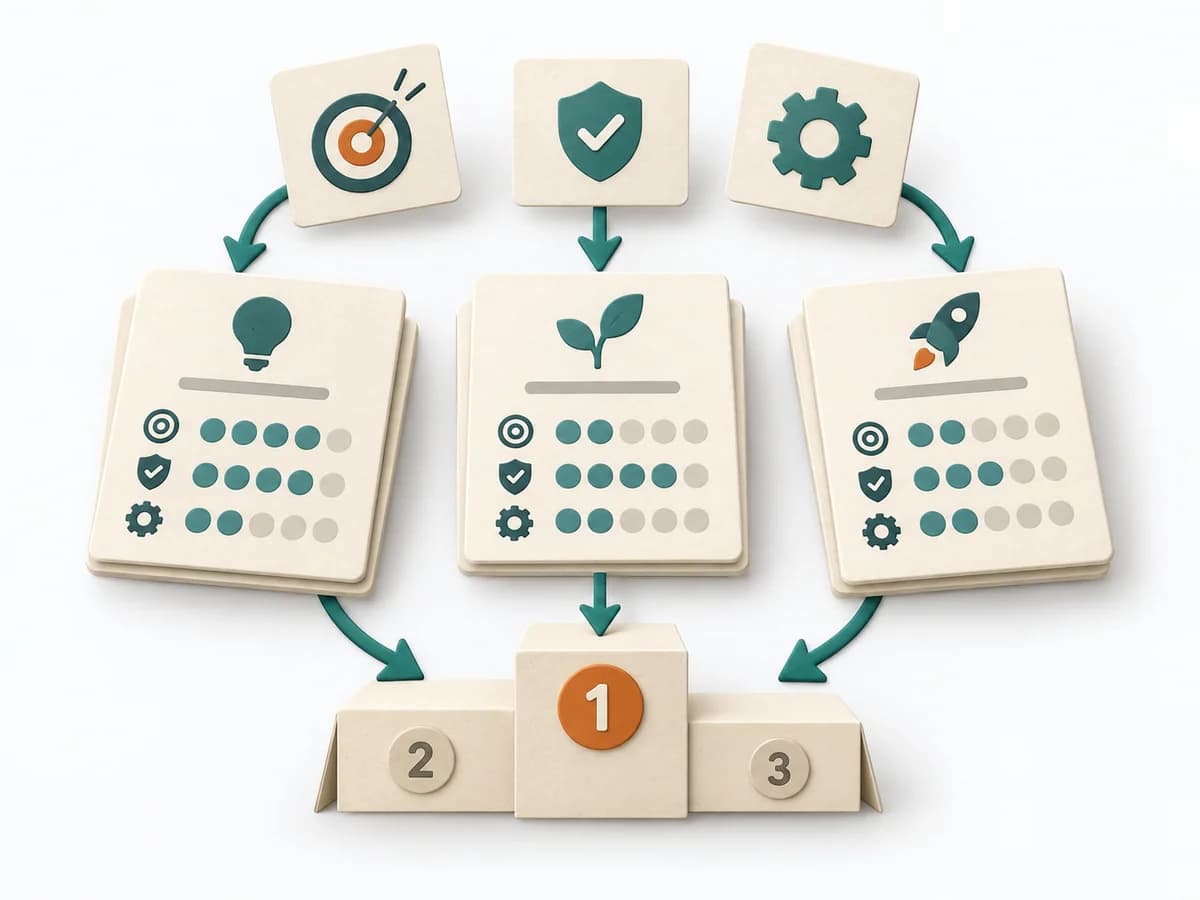 Product Strategy ICE Scoring | 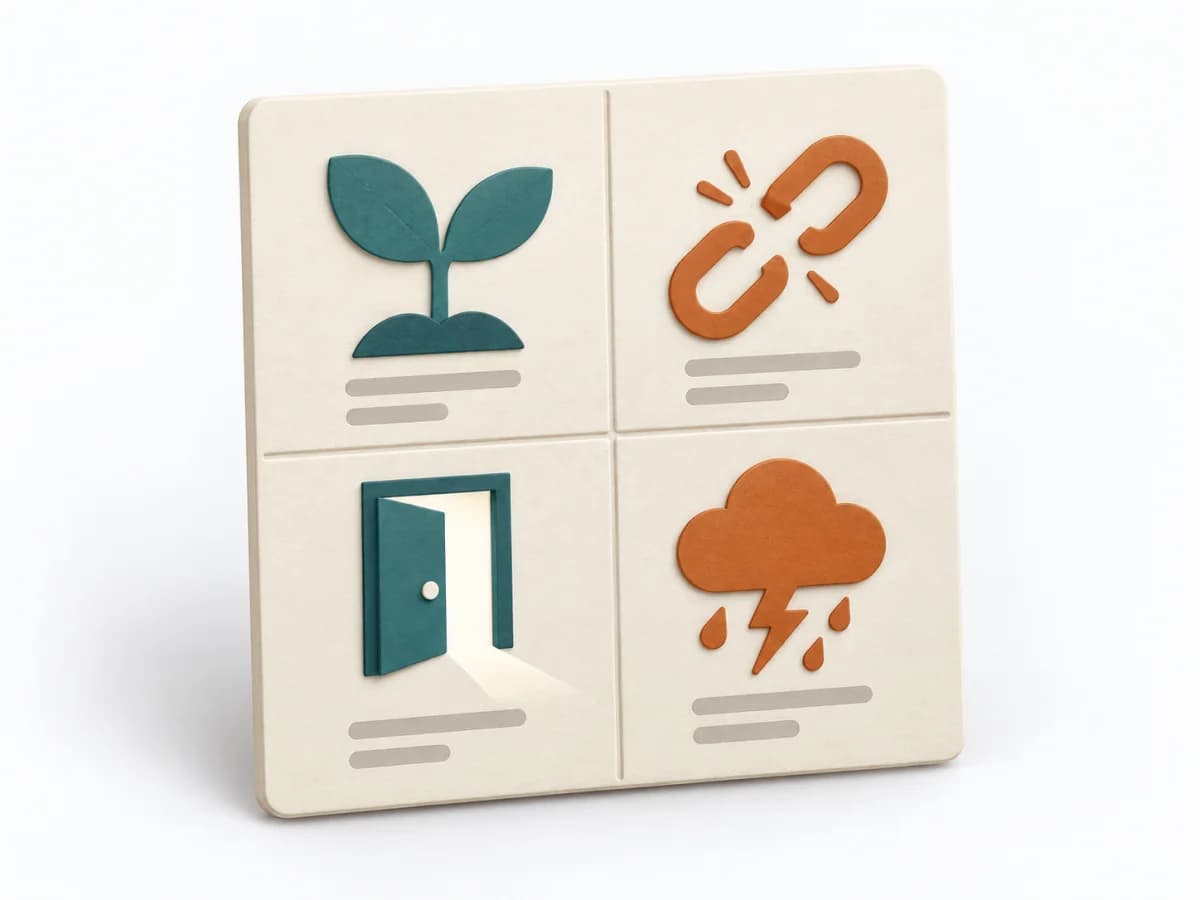 Business Strategy SWOT Analysis | 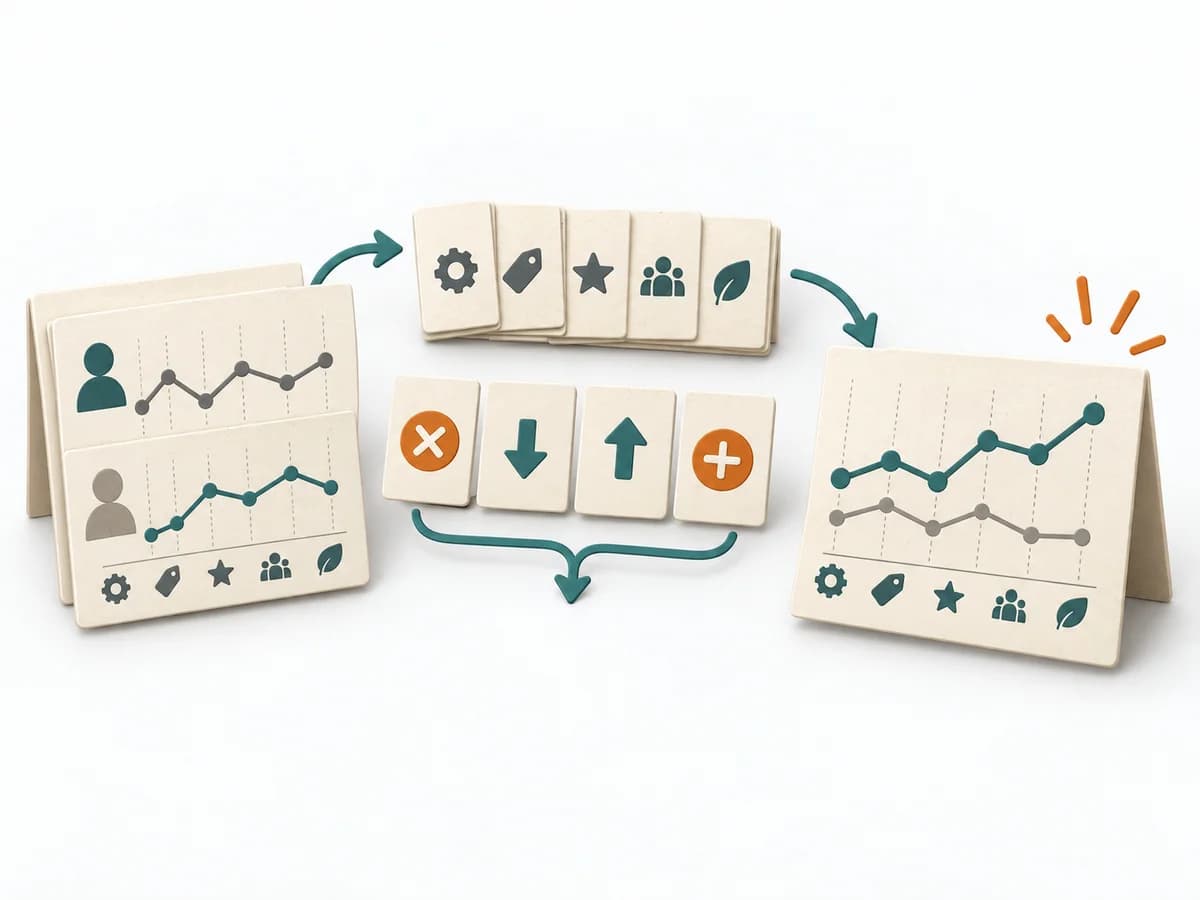 Business Strategy Blue Ocean Strategy Canvas |
|---|---|---|---|---|
Purposedifferent | PESTLE Analysis makes political, economic, social, technological, legal, and environmental influences visible. The environment of an initiative is thereby read systematically instead of through isolated trends. | When ideas need sorting quickly, it condenses impact, confidence, and effort into one compact score. It connects customer value, product logic, and decision priorities. The result is captured as an ICE table and top-ideas list. | SWOT Analysis arranges strengths, weaknesses, opportunities, and threats into a compact picture of the situation. It keeps internal capabilities and external influences separate before strategic options emerge from them. | The Blue Ocean Strategy Canvas shows how an offering is positioned relative to the market. Differentiation thereby becomes tangible in value factors instead of merely being claimed. |
Complexitydifferent | Medium | Low | Low | Medium |
Timedifferent | 1-3 h | 30-60 min | 30-60 min | 2-4 h |
Participantsdifferent | 2-10 | 2-8 | 3-12 | 3-10 |
Formatdifferent | Workshop + async | Workshop + async | Workshop | Workshop |
Outputdifferent | PESTLE Map, External Risks, Strategic Questions | ICE Table, Top Idea List | SWOT matrix, Strategic options, Action list | Strategy Canvas, Value Curve, ERRC Actions |
Tagsno overlap | StrategyMarketAnalysis | PrioritizationScoringGrowthDecision | StrategyAnalysisMarketPositioning | StrategyPositioningInnovationValue |