View methods side by side.
Choose up to four methods. Add them using the search and share the comparison by copying its link.
| Criterion | 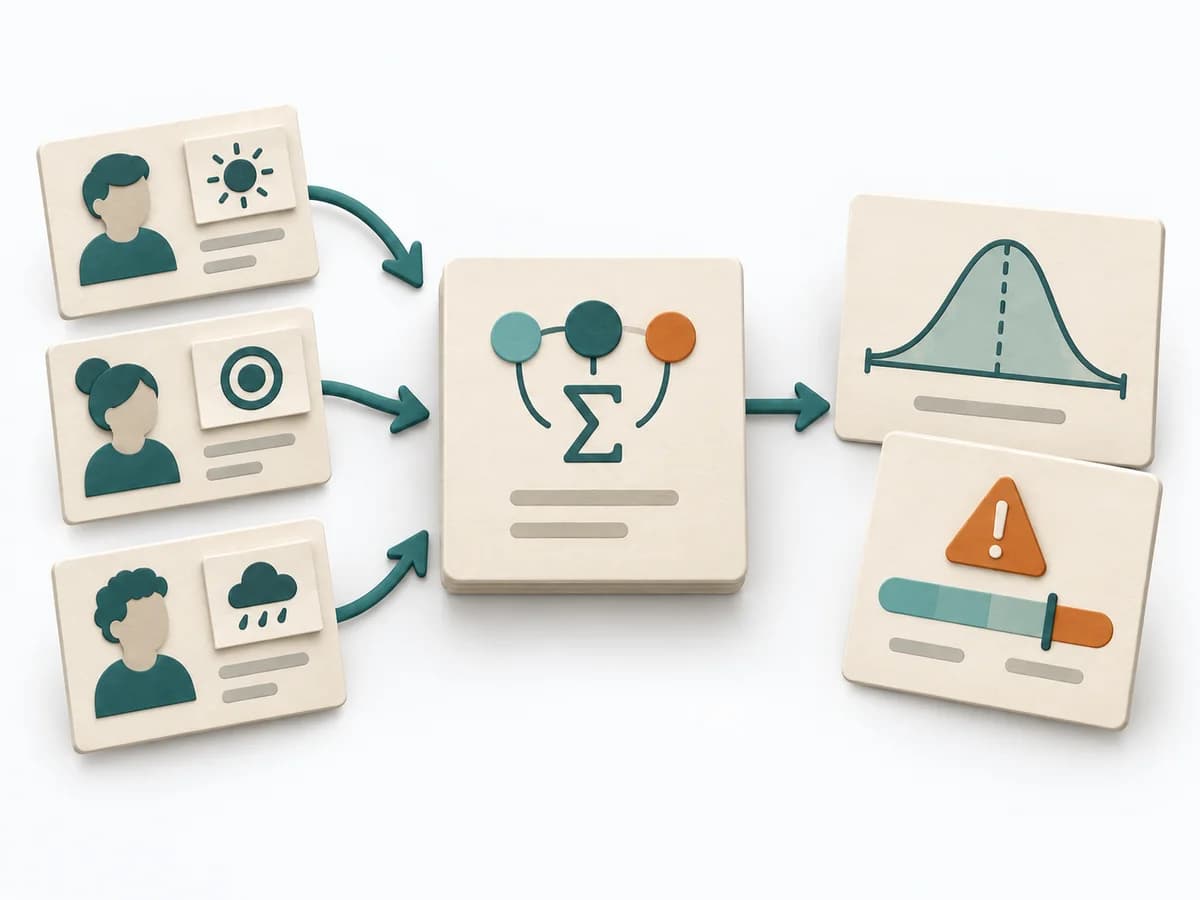 Decision Making PERT Estimation | 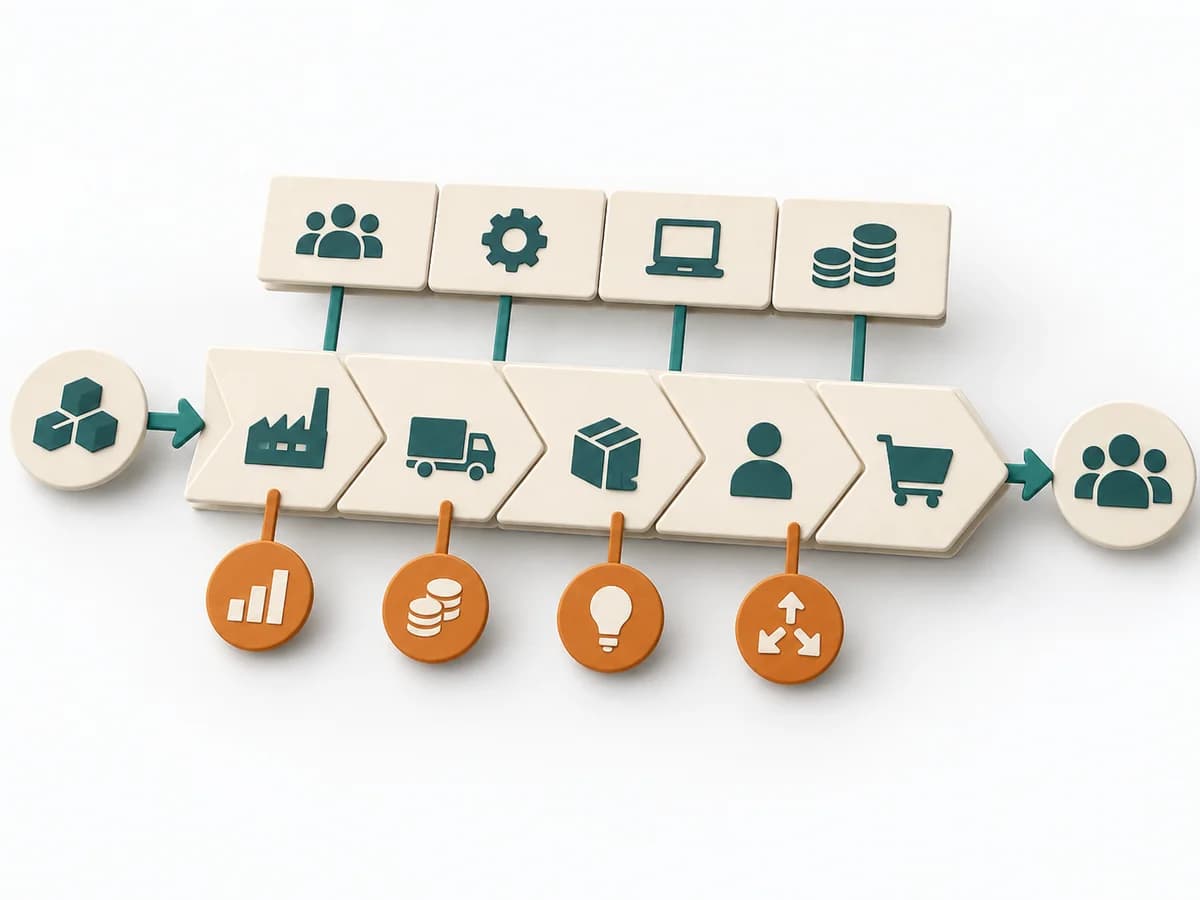 Business Strategy Value Chain Analysis |  Business Strategy SWOT Analysis |  Business Strategy PESTLE Analysis |
|---|---|---|---|---|
Purposedifferent | On complex initiatives, a plain average tends to understate just how uncertain the outcome really is. It separates options, evaluation criteria, and open risks. The result is captured as a PERT Estimate, Expected Value, and Risk Notes. | Value Chain Analysis shows where value is created, costs accrue, and differentiation becomes possible along the process. It compares strengths, risks, market logic, and courses of action. The result is captured as a value-chain map and lever list. | SWOT Analysis arranges strengths, weaknesses, opportunities, and threats into a compact picture of the situation. It keeps internal capabilities and external influences separate before strategic options emerge from them. | PESTLE Analysis makes political, economic, social, technological, legal, and environmental influences visible. The environment of an initiative is thereby read systematically instead of through isolated trends. |
Complexitydifferent | Medium | High | Low | Medium |
Timedifferent | 15-45 min | Half day | 30-60 min | 1-3 h |
Participantsdifferent | 1-8 | 3-8 | 3-12 | 2-10 |
Formatdifferent | Workshop + async | Workshop | Workshop | Workshop + async |
Outputdifferent | PERT Estimate, Expected Value, Risk Notes | Value Chain Map, Lever List | SWOT matrix, Strategic options, Action list | PESTLE Map, External Risks, Strategic Questions |
Tagsno overlap | EstimationUncertaintyRisk | StrategyBusiness modelDiagnosisAnalysis | StrategyAnalysisMarketPositioning | StrategyMarketAnalysis |