View methods side by side.
Choose up to four methods. Add them using the search and share the comparison by copying its link.
| Criterion | 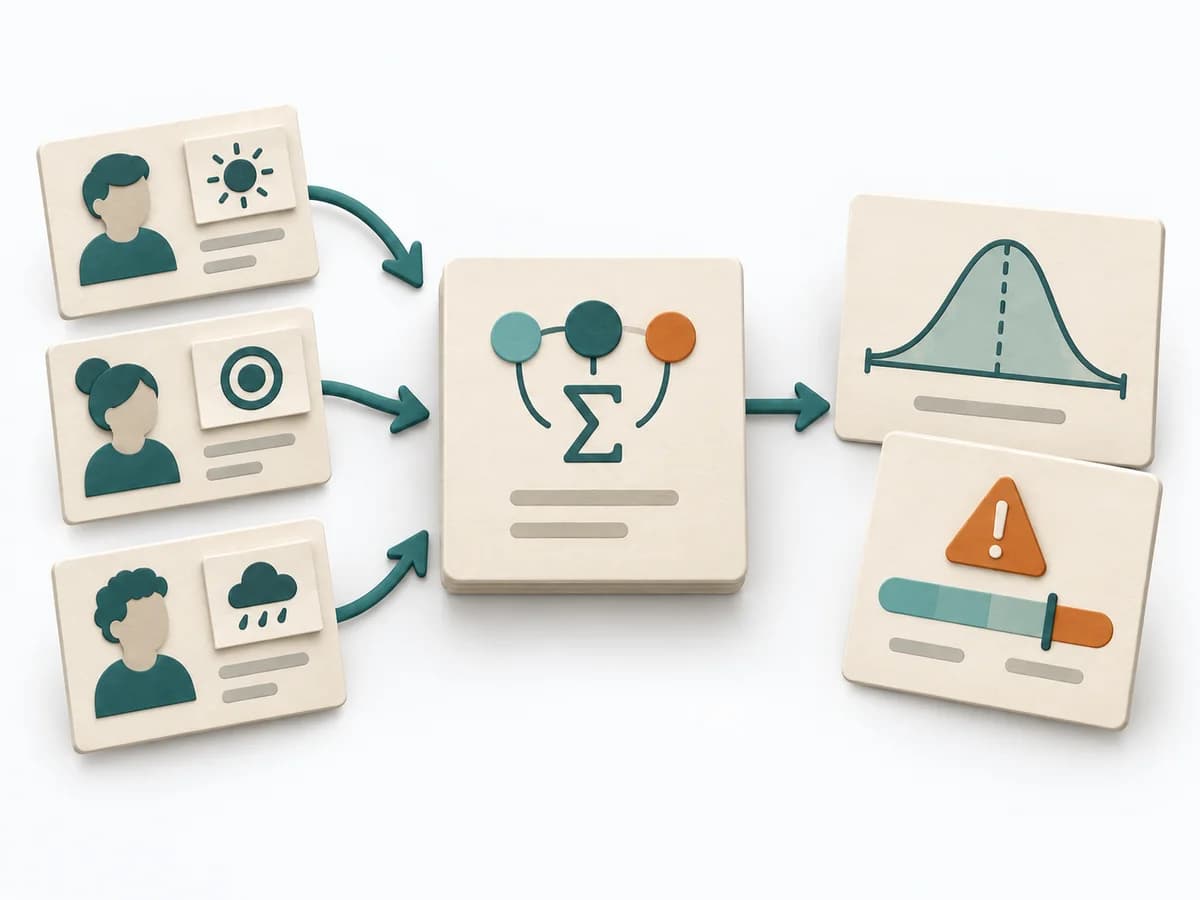 Decision Making PERT Estimation | 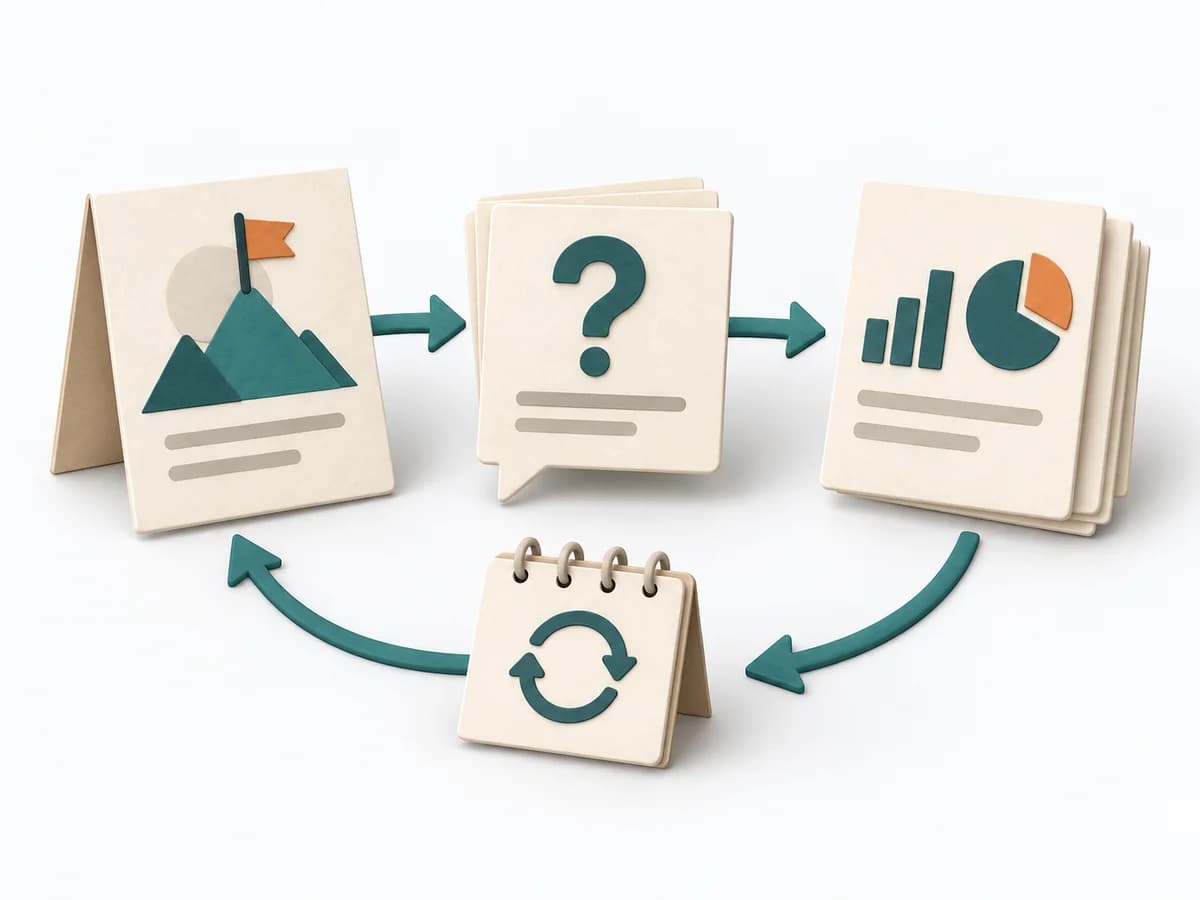 Engineering Goal Question Metric | 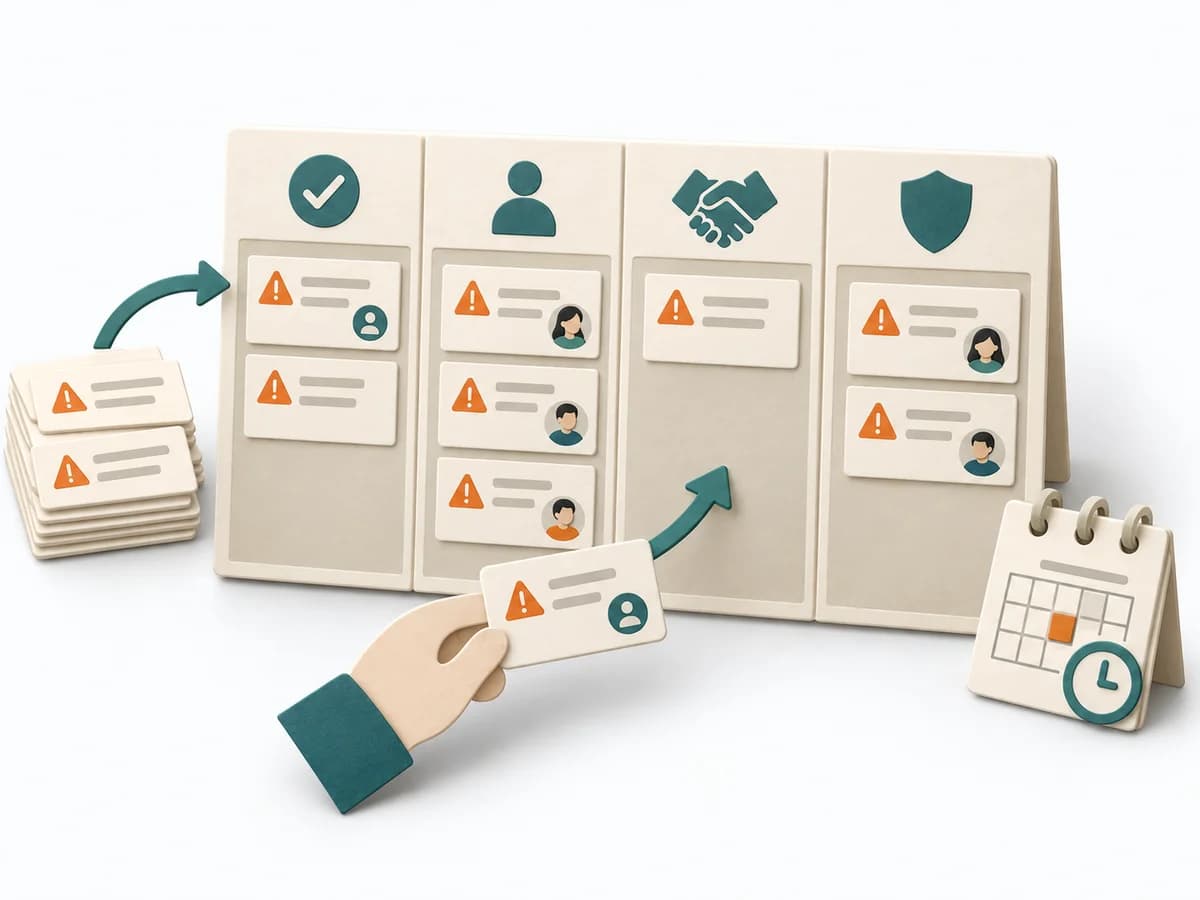 Agile ROAM Board |
|---|---|---|---|
Purposedifferent | On complex initiatives, a plain average tends to understate just how uncertain the outcome really is. It separates options, evaluation criteria, and open risks. The result is captured as a PERT Estimate, Expected Value, and Risk Notes. | Helps clarify technical problems, hypotheses, and next steps in concrete terms. It breaks a technical problem into testable parts. The result is captured as a GQM table and metric briefs. | When work needs to move between different states or columns, it makes that movement and its handoffs legible. It sorts work by value, risk, and delivery ability. The result is captured as a ROAM Board and an Owner List. |
Complexitydifferent | Medium | Medium | Low |
Timedifferent | 15-45 min | 90-180 min | 20-40 min initial, dann laufend |
Participantsdifferent | 1-8 | 3-6 | 3-15 |
Formatdifferent | Workshop + async | Workshop | Workshop + async |
Outputdifferent | PERT Estimate, Expected Value, Risk Notes | GQM Table, Metric Profiles | ROAM Board, Owner List |
Tagsno overlap | EstimationUncertaintyRisk | MetricsMeasurementEngineeringAlignment | RiskAgileTrackingAlignment |
Often compared together
Methods with strong topical overlap with the current selection, not yet in the comparison.