View methods side by side.
Choose up to four methods. Add them using the search and share the comparison by copying its link.
| Criterion | 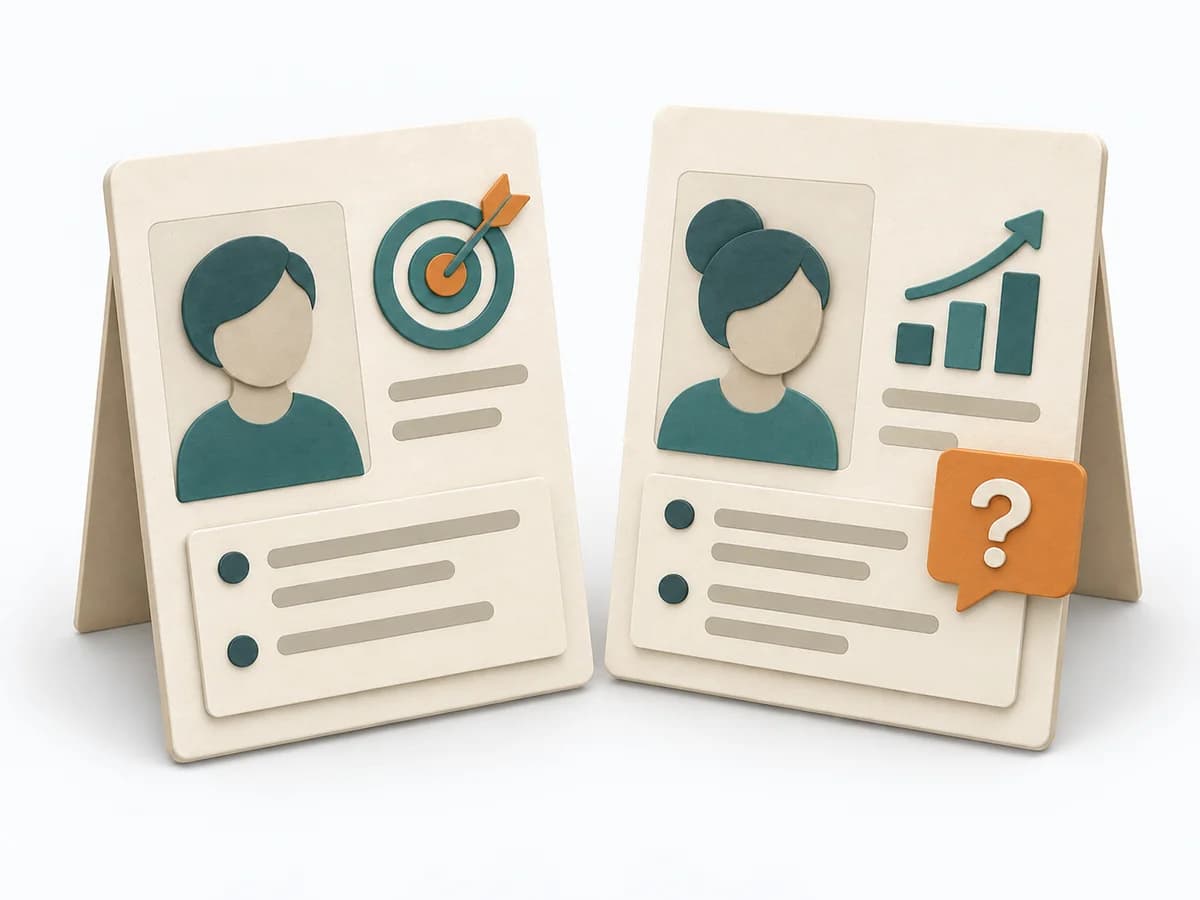 UX Research Personas | 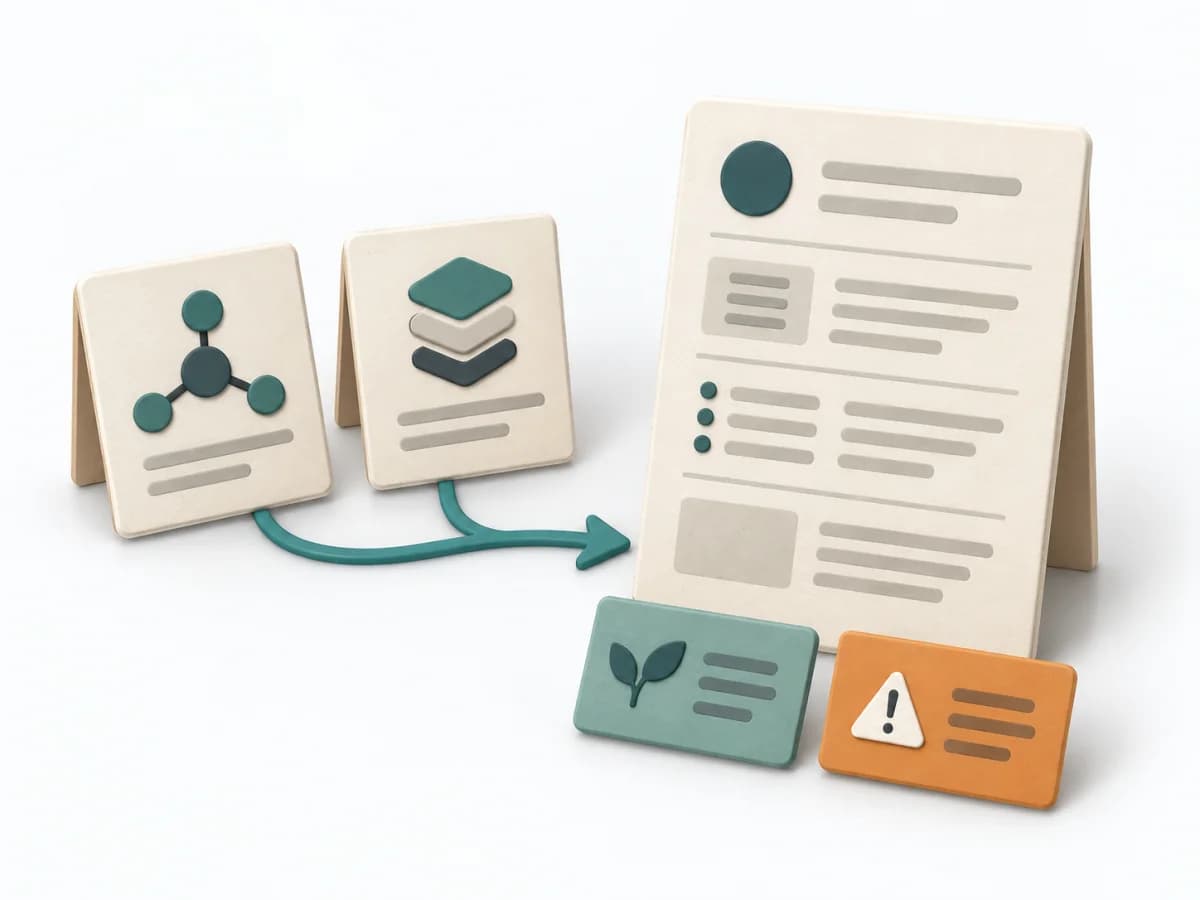 Architecture Architecture Decision Record |  Operations Fishbone Diagram |
|---|---|---|---|
Purposedifferent | When target groups stay too vague and teams talk about the same people differently, personas create a shared, solid picture of usage. Condensed profiles make needs, contexts, and differences tangible enough for decisions. | An ADR permanently records an architecture decision with context, trade-offs, and consequence. It creates continuity for later changes because the decision path stays traceable. | When a problem has several possible contributing factors, the method sorts causes by cause areas. It prevents an initial hunch from blocking the view of other plausible drivers. |
Complexitydifferent | Medium | Low | Low |
Timedifferent | 1-3 Tage | 15-45 min | 30-60 min |
Participantsdifferent | Internes Team | 1-3 | 2-8 |
Formatdifferent | Workshop + async | Async | Workshop |
Outputdifferent | Persona Profiles, Needs Summary, Scenario Notes | ADR File, Decision Log, Rationale | Fishbone Diagram, Cause Categories, Investigation Backlog |
Tagsno overlap | ResearchCustomerSynthesis | ArchitectureRationaleDocumentationGovernance | Root causeQualityOperations |
Often compared together
Methods with strong topical overlap with the current selection, not yet in the comparison.