View methods side by side.
Choose up to four methods. Add them using the search and share the comparison by copying its link.
| Criterion | 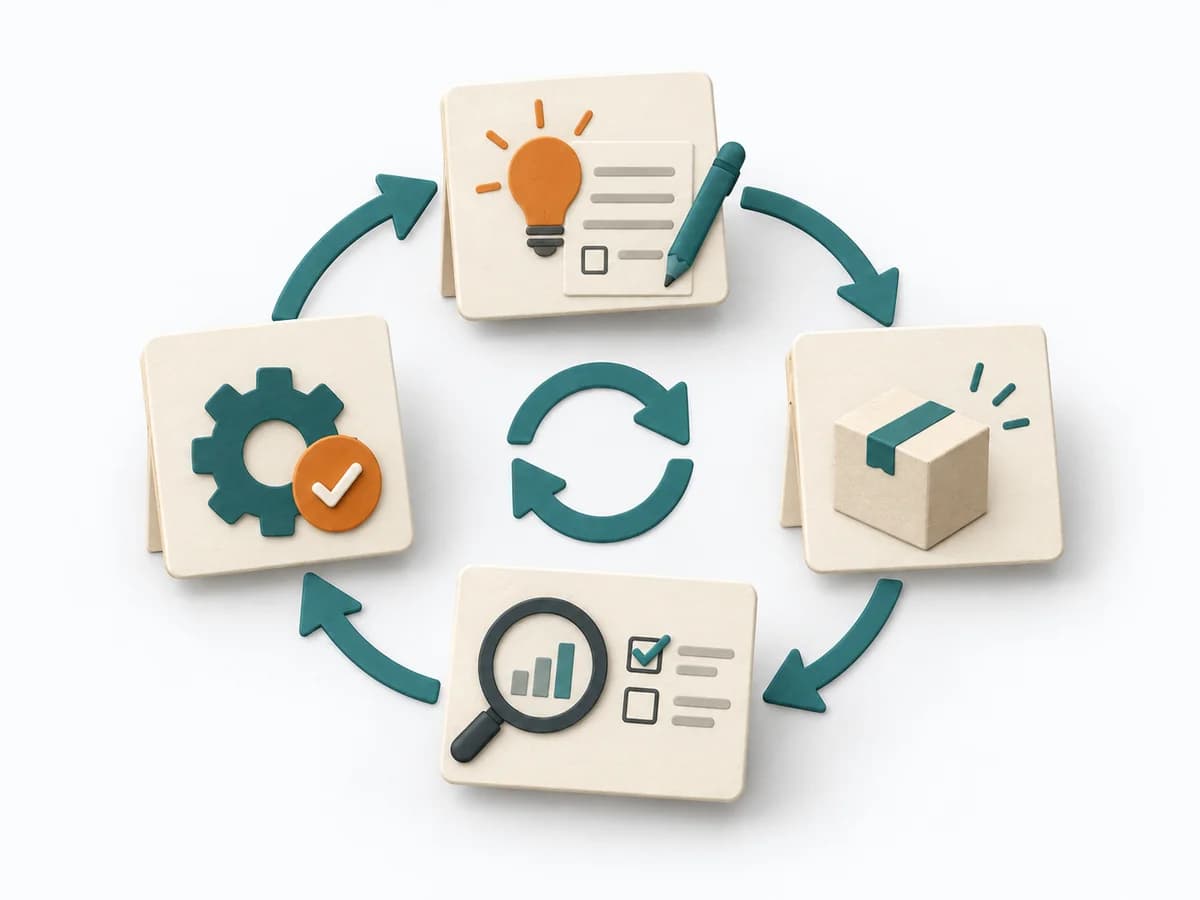 Operations PDCA Cycle |  Agile NoEstimates | 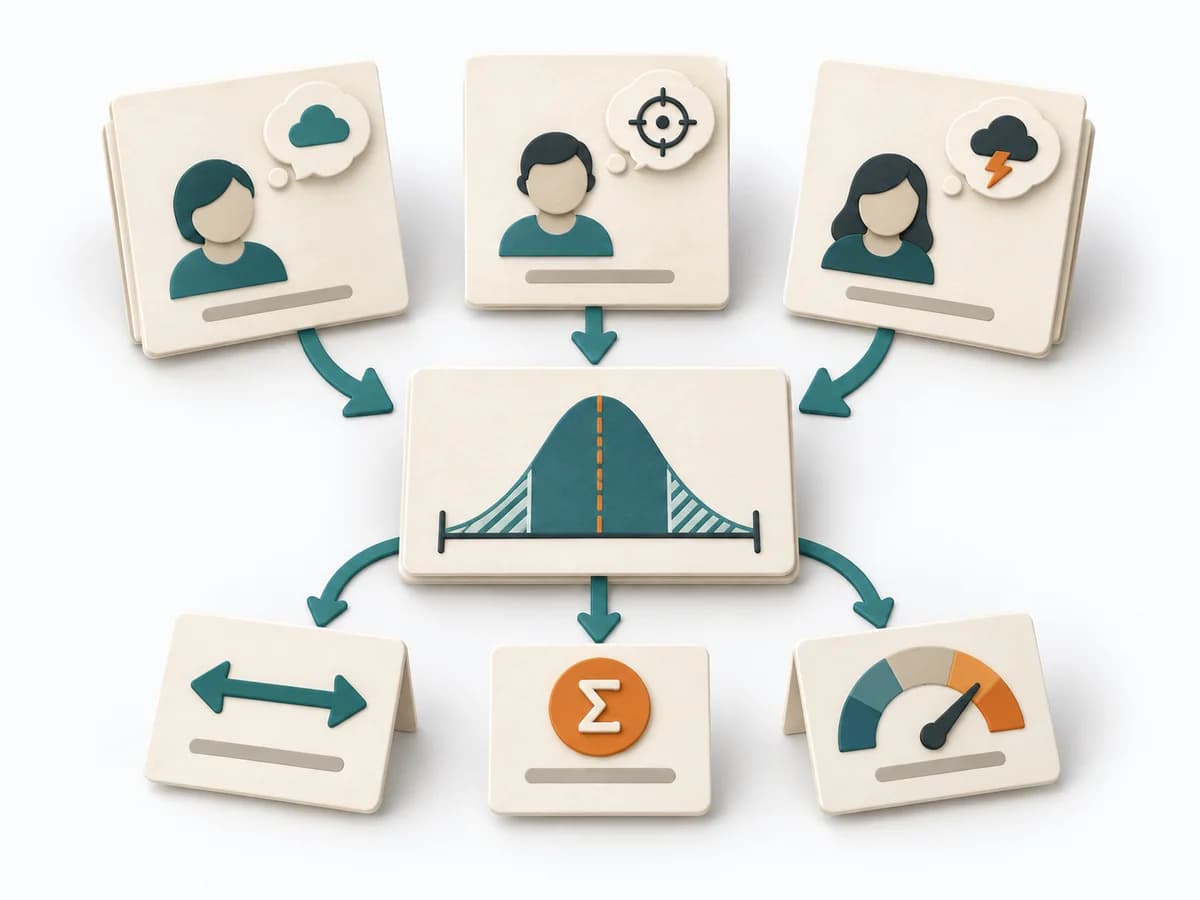 Decision Making Three-Point Estimation |  Delivery Value Stream Mapping |
|---|---|---|---|---|
Purposedifferent | For an improvement that still has to prove itself in everyday work, the method runs it through small learning loops. It connects planning, checking, and standardization into a repeatable learning mode. | When estimating slows a team down more than it helps, it shifts the focus to flow, small slices, and real lead time. It sorts work by value, risk, and delivery ability. The result is captured as Throughput Data, Flow Forecast, and Slicing Rules. | A single estimate for effort, time, or risk often looks too smooth for the real uncertainty behind it. It separates options, evaluation criteria, and open risks. The result is captured as a Three-Point Estimate, Risk Range, and Assumption Notes. | When delivery work dissolves into wait times, handoffs, and hidden effort, Value Stream Mapping makes the actual flow visible. The method exposes bottlenecks, idle time, and feedback loops so lead time and improvement levers become tangible. |
Complexitydifferent | Low | Medium | Medium | Medium |
Timedifferent | 1 h bis mehrere Wochen | laufend | 10-30 min je Item | 1-3 h |
Participantsdifferent | 1-8 | 2-12 | 1-8 | 4-10 |
Formatdifferent | Workshop + async | Workshop + async | Workshop + async | Workshop |
Outputdifferent | PDCA Log, Experiment Plan, Learning Outcome, Standard Change | Throughput Data, Flow Forecast, Slicing Rules | Three-Point Estimate, Risk Range, Assumption Notes | Current-state map, Future-state map, Bottleneck list |
Tagsno overlap | Continuous improvementLeanExperiments | EstimationForecastingFlow | EstimationUncertaintyForecasting | LeanFlowWasteDelivery |