View methods side by side.
Choose up to four methods. Add them using the search and share the comparison by copying its link.
| Criterion | 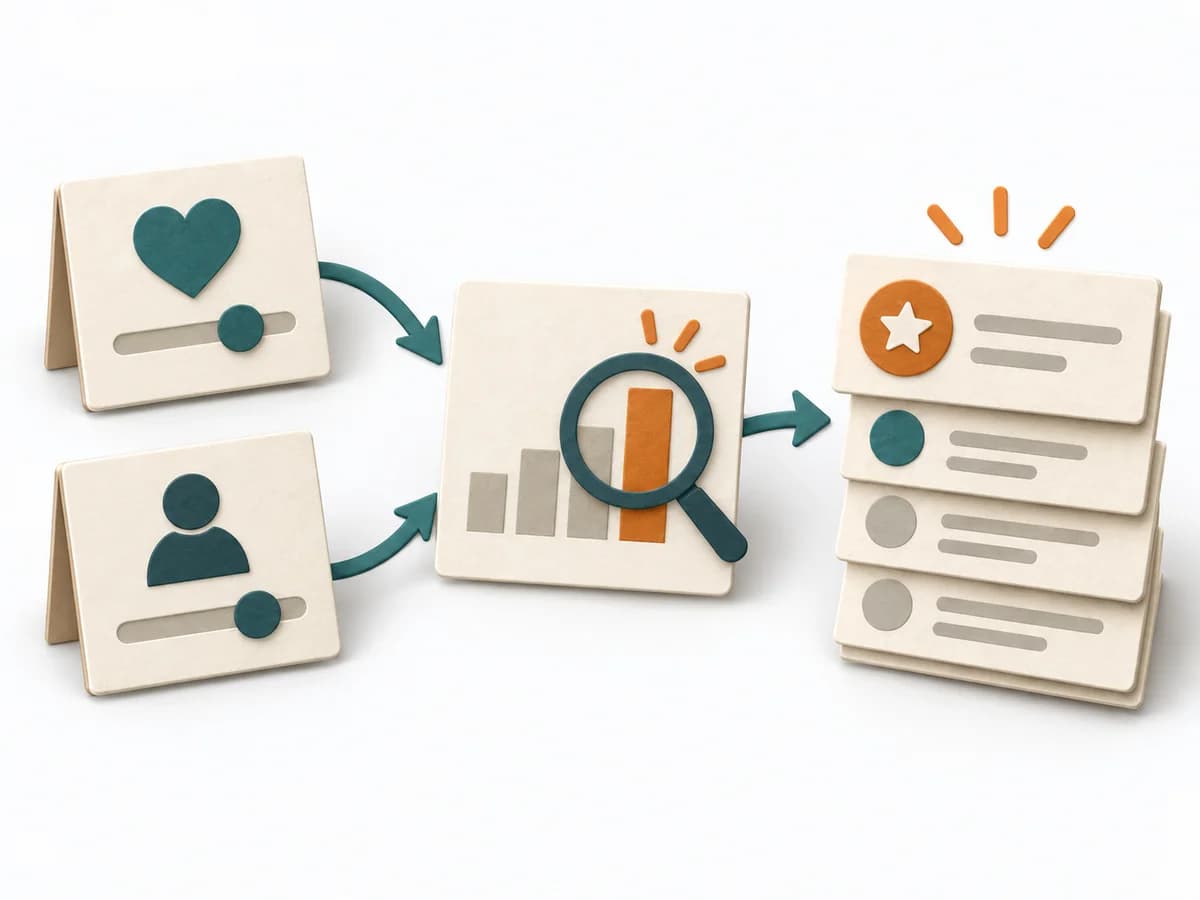 Product Discovery Opportunity Scoring | 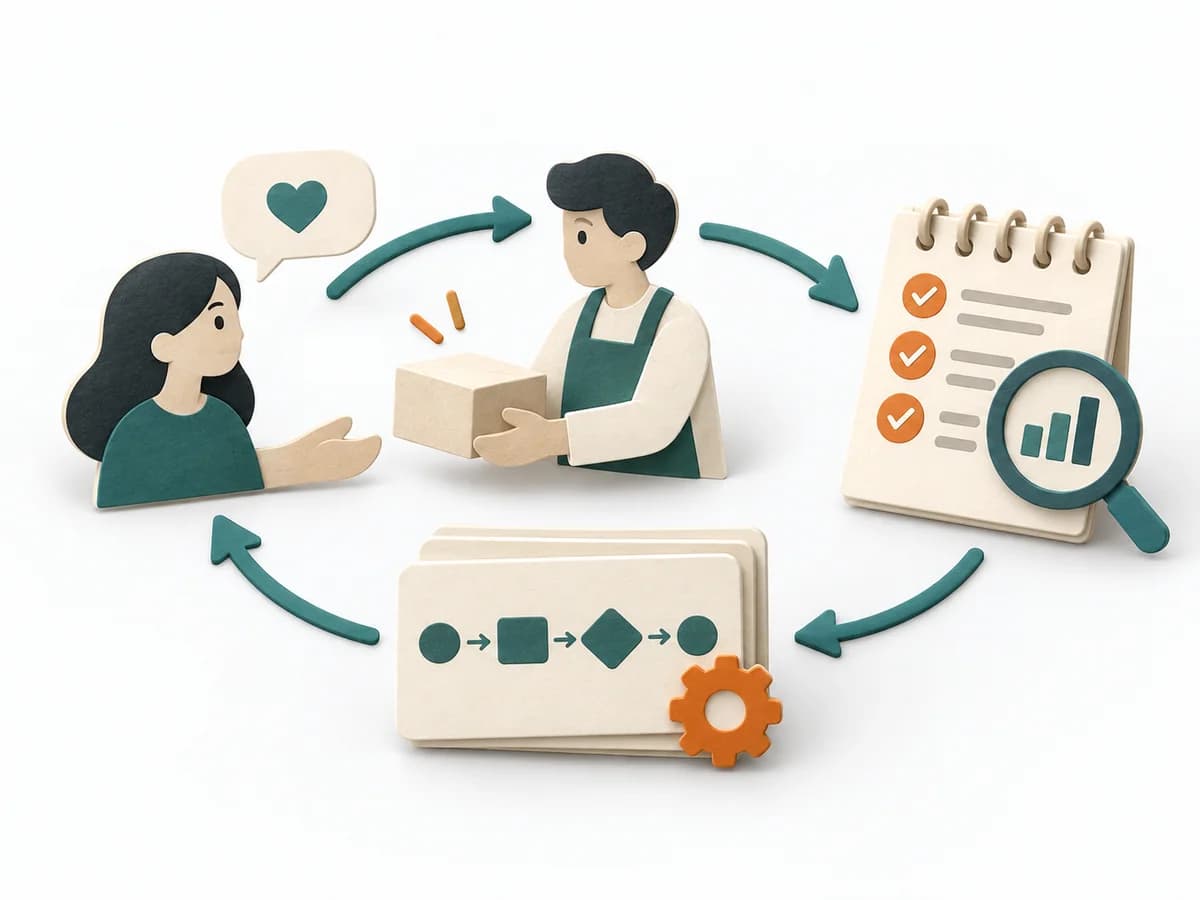 Product Discovery Concierge MVP |  UX Research Customer Journey Mapping | 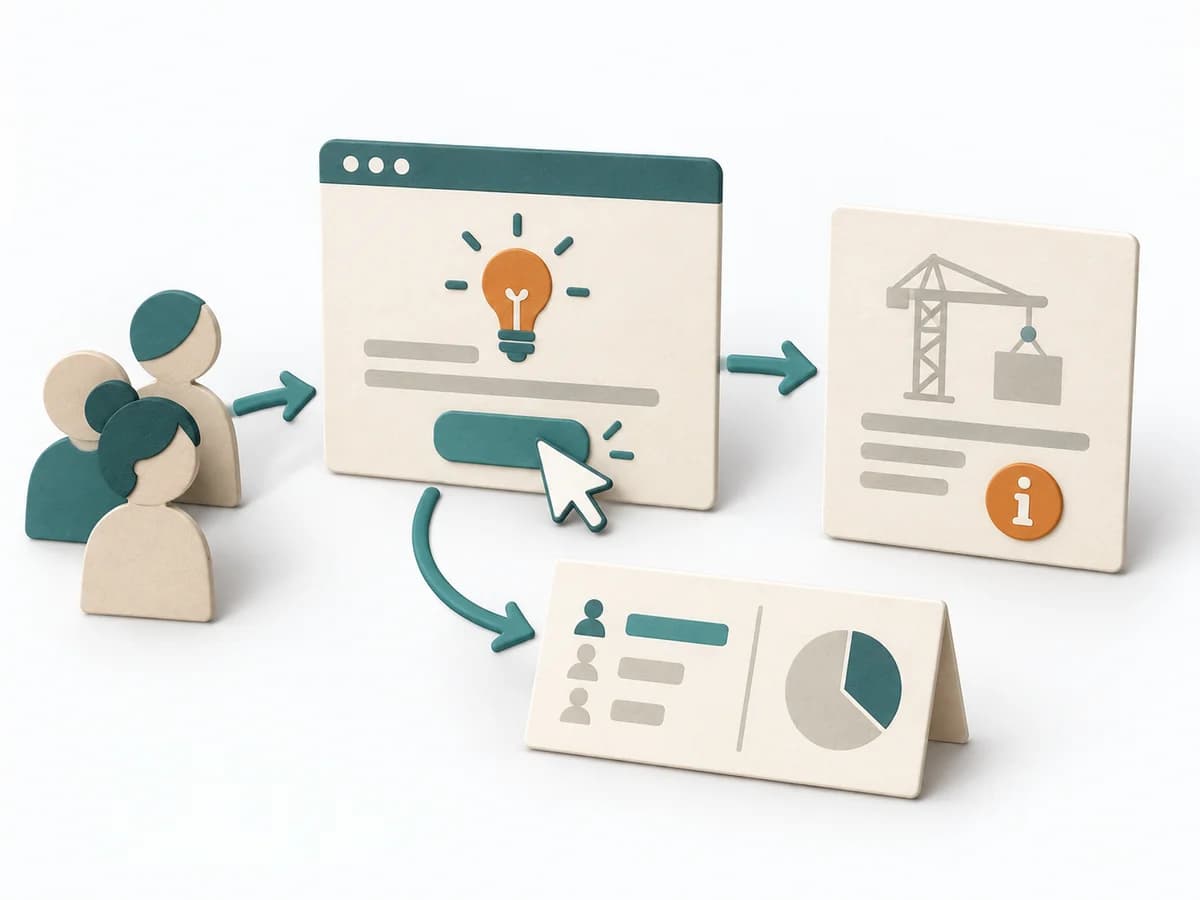 Product Discovery Fake Door Test |
|---|---|---|---|---|
Purposedifferent | When opportunities need ranking by their effect, it makes importance and satisfaction directly comparable. It separates problem, assumption, solution, and evidence. The result is captured as an opportunity-score table and top outcomes. | When an idea can first fail or grow through genuine hands-on support, it relies on manual work instead of automation. It shows whether user value holds up even under manual execution. | When a user journey falls apart across many touchpoints, customer journey mapping makes the experience visible as a coherent arc. Phases, emotions, and breaks become legible enough to prioritize critical moments deliberately. | When demand is still unclear, it measures interest in a feature before it is built. It separates real behavior from polite agreement and deliberately keeps build effort small. |
Complexitysame | Medium | Medium | Medium | Medium |
Timedifferent | 60-120 min | 1-4 Wochen | 2-4 h | 1-5 Tage |
Participantsdifferent | 3-6 | 3-10 Kunden | 4-10 | Nutzertraffic |
Formatdifferent | Workshop + async | Workshop + async | Workshop | Async |
Outputdifferent | Opportunity Score Table, Top Outcomes | Concierge Learnings, Service Blueprint, MVP Risks | Journey Map, Pain-point List, Opportunity Backlog | Click Data, Interest Signal, Learning Decision |
Tagsno overlap | PrioritizationDiscoveryOutcomesNeeds | MVPValidationServiceDiscovery | JourneyServiceService design | ValidationExperimentsDemandDiscovery |