View methods side by side.
Choose up to four methods. Add them using the search and share the comparison by copying its link.
| Criterion |  Agile NoEstimates | 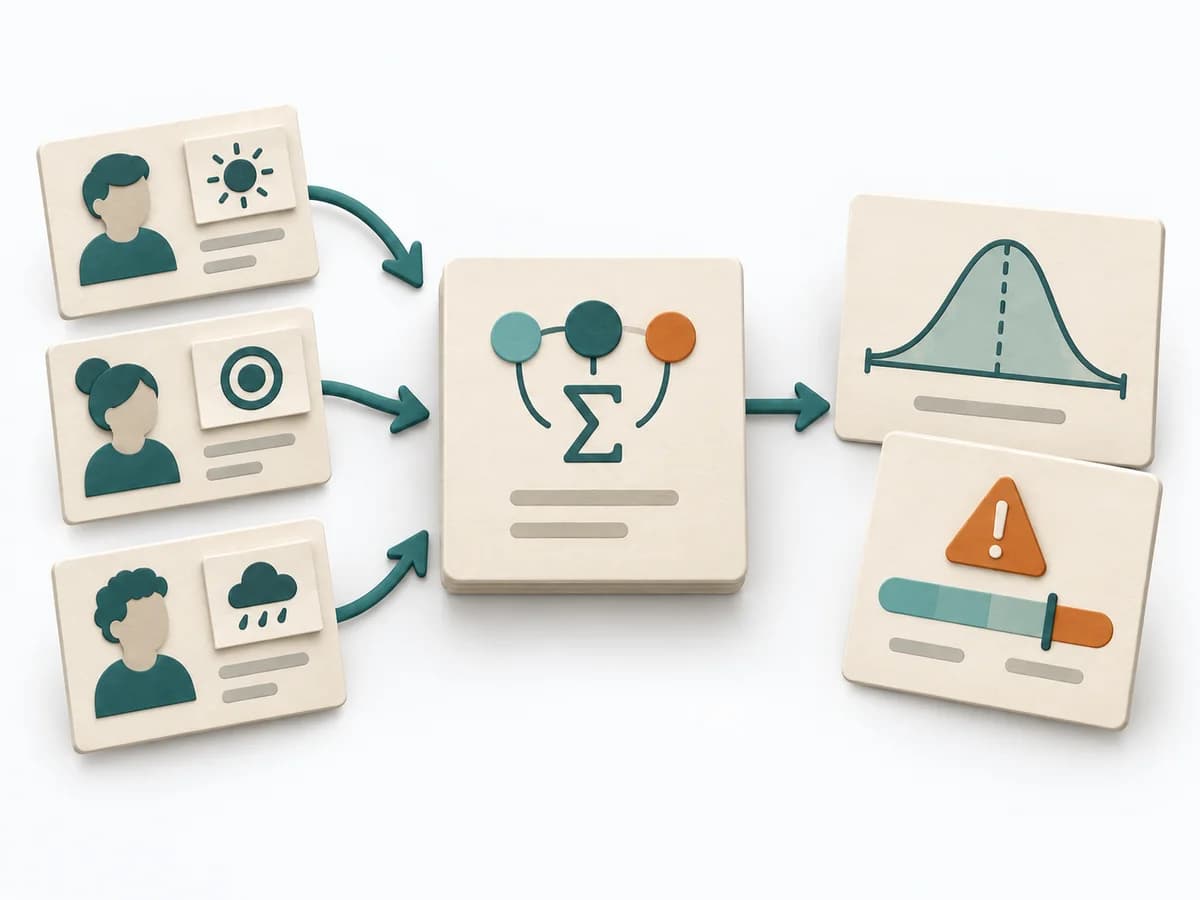 Decision Making PERT Estimation |  Growth A/B Testing |  Product Discovery Smoke Test |
|---|---|---|---|---|
Purposedifferent | When estimating slows a team down more than it helps, it shifts the focus to flow, small slices, and real lead time. It sorts work by value, risk, and delivery ability. The result is captured as Throughput Data, Flow Forecast, and Slicing Rules. | On complex initiatives, a plain average tends to understate just how uncertain the outcome really is. It separates options, evaluation criteria, and open risks. The result is captured as a PERT Estimate, Expected Value, and Risk Notes. | When two variants compete, discussions quickly decide by taste rather than effect. A/B Testing checks behavior under controlled conditions and separates real improvement from chance or expectation effects. | When demand only needs to be roughly verified, it tests interest with minimal effort. It measures whether people would take a next step at all. |
Complexitydifferent | Medium | Medium | High | Low |
Timedifferent | laufend | 15-45 min | 1-4 Wochen | 1-5 Tage |
Participantsdifferent | 2-12 | 1-8 | 1-6 | Nutzertraffic |
Formatdifferent | Workshop + async | Workshop + async | Async | Async |
Outputdifferent | Throughput Data, Flow Forecast, Slicing Rules | PERT Estimate, Expected Value, Risk Notes | Experiment results, Decision log, Learning summary | Interest Metrics, Conversion Signal, Learning Note |
Tagsno overlap | EstimationForecastingFlow | EstimationUncertaintyRisk | ExperimentsGrowthAnalyticsValidation | ValidationExperimentsDemandGrowth |