View methods side by side.
Choose up to four methods. Add them using the search and share the comparison by copying its link.
| Criterion |  Agile NoEstimates |  Business Strategy McKinsey 7S | 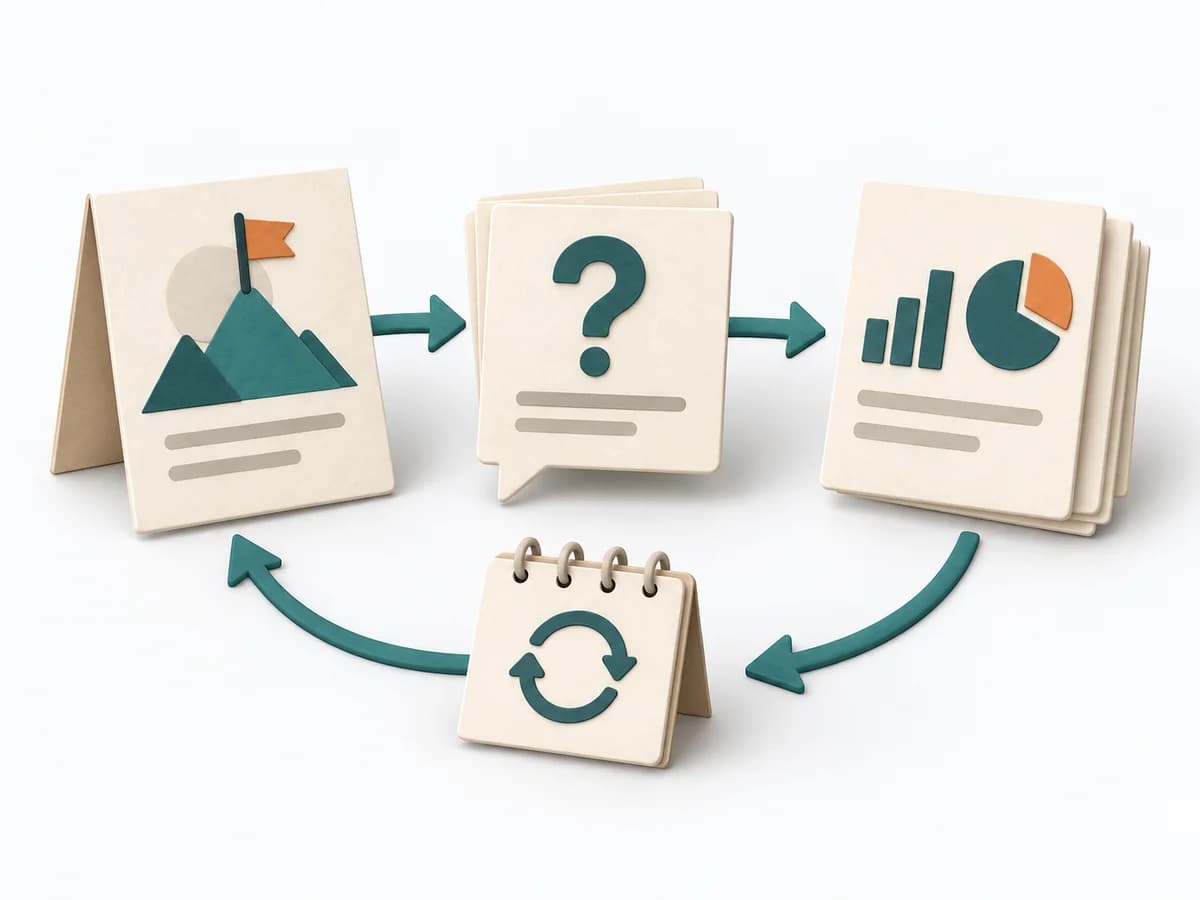 Engineering Goal Question Metric | 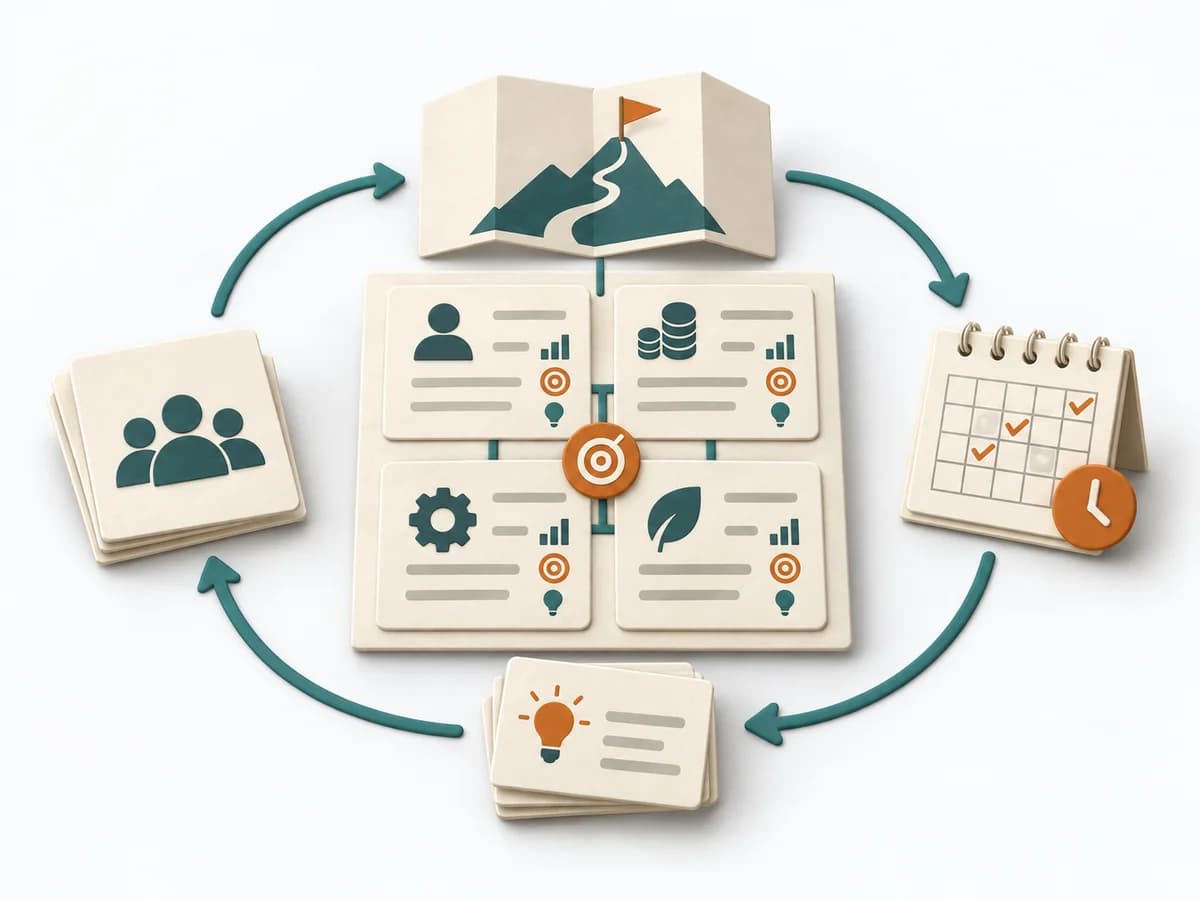 Business Strategy Balanced Scorecard |
|---|---|---|---|---|
Purposedifferent | When estimating slows a team down more than it helps, it shifts the focus to flow, small slices, and real lead time. It sorts work by value, risk, and delivery ability. The result is captured as Throughput Data, Flow Forecast, and Slicing Rules. | McKinsey 7S checks whether Strategy, Structure, Systems, Shared Values, Skills, Style, and Staff fit together. Organizational misalignments become visible across multiple levers as a result. | Helps clarify technical problems, hypotheses, and next steps in concrete terms. It breaks a technical problem into testable parts. The result is captured as a GQM table and metric briefs. | Balanced Scorecard translates strategy into a few interconnected perspectives and metrics. It holds impact, steering, and learning together in daily work instead of narrowing strategy down to financial figures. |
Complexitydifferent | Medium | Medium | Medium | High |
Timedifferent | laufend | 2-4 h | 90-180 min | Halber Tag bis mehrere Wochen |
Participantsdifferent | 2-12 | 3-12 | 3-6 | 4-12 |
Formatdifferent | Workshop + async | Workshop | Workshop | Workshop + async |
Outputdifferent | Throughput Data, Flow Forecast, Slicing Rules | 7S Assessment, Alignment Gaps, Change Actions | GQM Table, Metric Profiles | Balanced Scorecard, Strategic Measures, Initiative Map |
Tagsno overlap | EstimationForecastingFlow | OrganizationStrategyAlignmentChange | MetricsMeasurementEngineeringAlignment | StrategyMetricsExecution |