View methods side by side.
Choose up to four methods. Add them using the search and share the comparison by copying its link.
| Criterion |  Agile NoEstimates |  Systems Thinking Leverage Points | 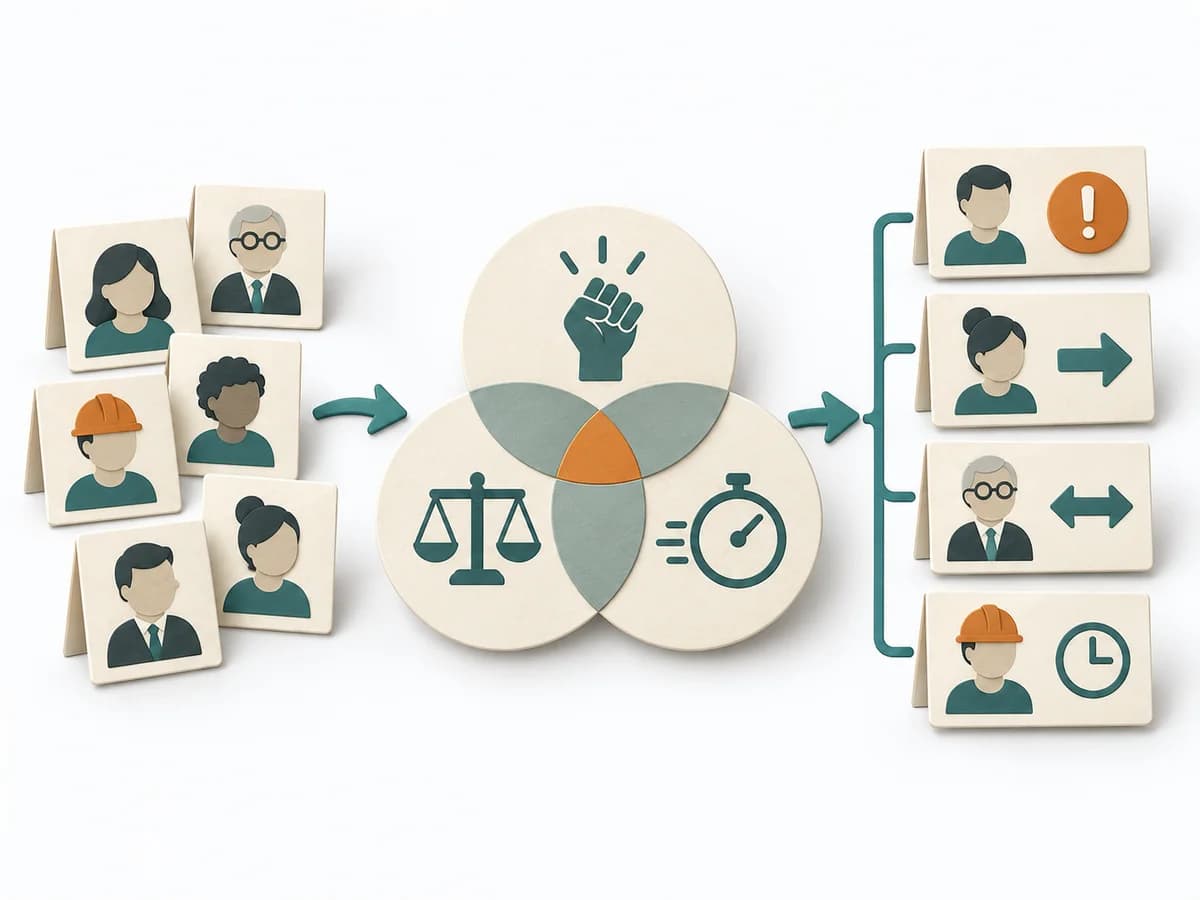 Facilitation Stakeholder Salience Model |  Business Strategy McKinsey 7S |
|---|---|---|---|---|
Purposedifferent | When estimating slows a team down more than it helps, it shifts the focus to flow, small slices, and real lead time. It sorts work by value, risk, and delivery ability. The result is captured as Throughput Data, Flow Forecast, and Slicing Rules. | Leverage Points show exactly where interventions in a system produce a disproportionate effect. It draws relationships, patterns, and feedback loops. The result is captured as a leverage map and action strategy. | When stakeholders appear to matter very differently, the Stakeholder Salience Model rates their actual priority through power, legitimacy, and urgency. It turns individual contributions into a visible selection. The result is captured as a Salience diagram and a class-based strategy. | McKinsey 7S checks whether Strategy, Structure, Systems, Shared Values, Skills, Style, and Staff fit together. Organizational misalignments become visible across multiple levers as a result. |
Complexitydifferent | Medium | High | Medium | Medium |
Timedifferent | laufend | Half day | 60-90 min | 2-4 h |
Participantsdifferent | 2-12 | 3-12 | 3-6 | 3-12 |
Formatdifferent | Workshop + async | Workshop | Workshop | Workshop |
Outputdifferent | Throughput Data, Flow Forecast, Slicing Rules | Leverage Map, Action Strategy | Salience Diagram, Strategy per Class | 7S Assessment, Alignment Gaps, Change Actions |
Tagsno overlap | EstimationForecastingFlow | Systems thinkingChangeStrategy | StakeholdersFacilitationAlignmentGovernance | OrganizationStrategyAlignmentChange |