View methods side by side.
Choose up to four methods. Add them using the search and share the comparison by copying its link.
| Criterion |  Agile NoEstimates | 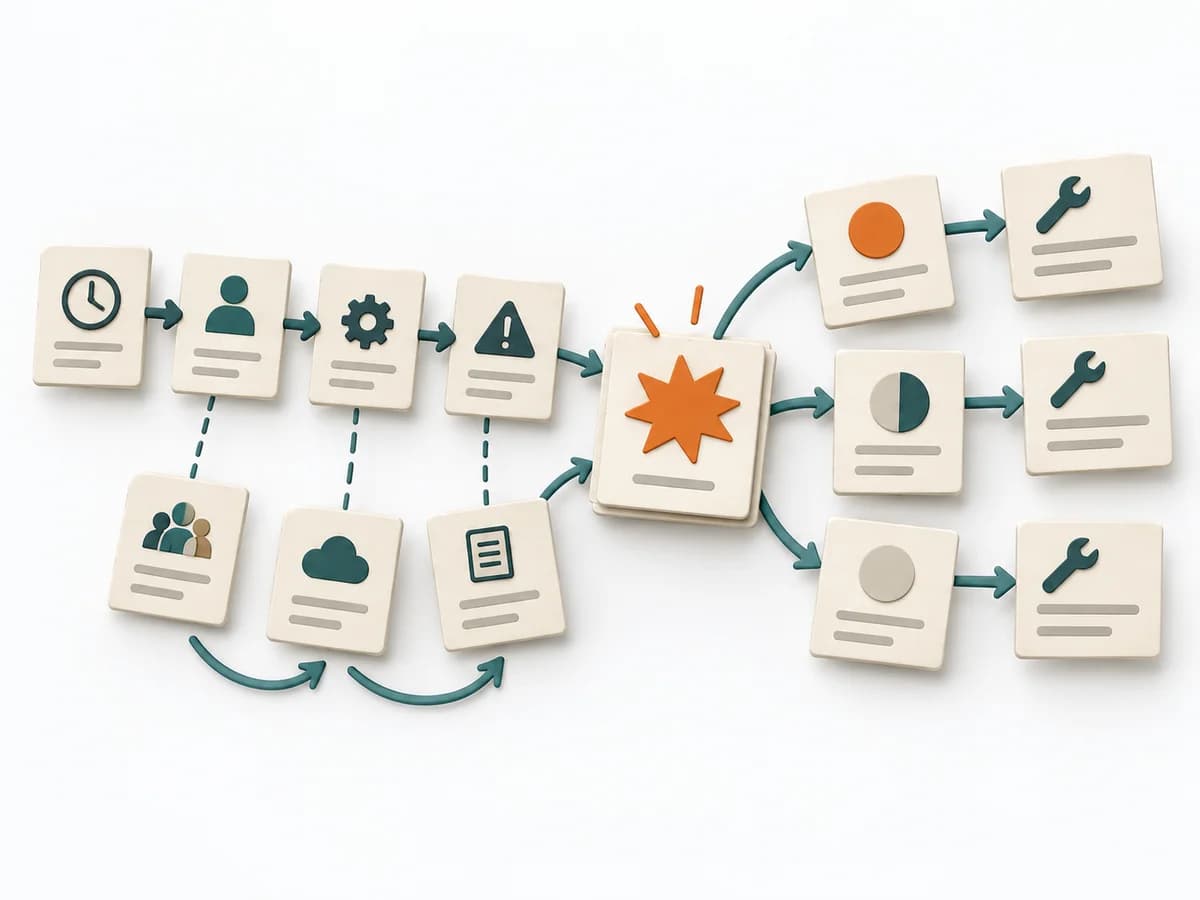 Operations Causal Factor Analysis |  Operations Failure Mode and Effects Analysis | 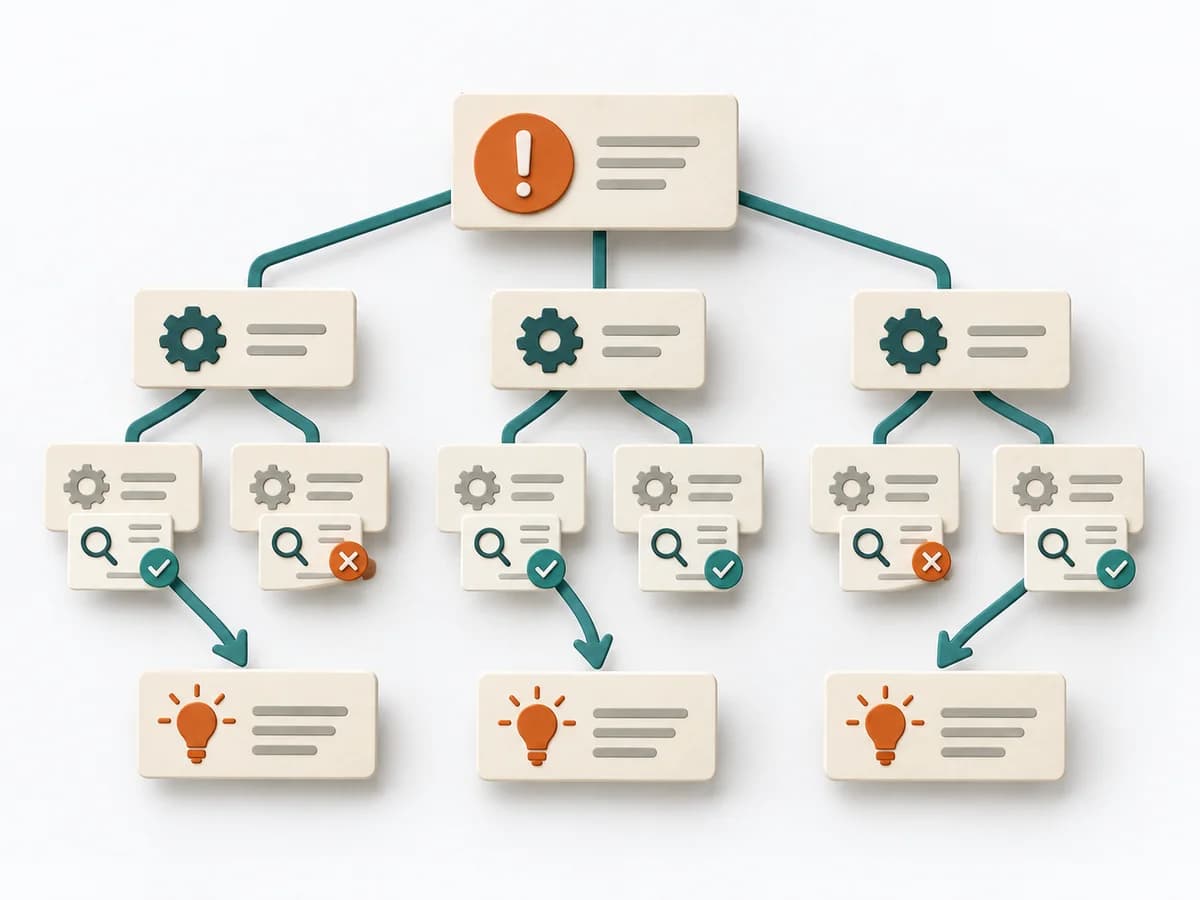 Operations Root Cause Tree Analysis |
|---|---|---|---|---|
Purposedifferent | When estimating slows a team down more than it helps, it shifts the focus to flow, small slices, and real lead time. It sorts work by value, risk, and delivery ability. The result is captured as Throughput Data, Flow Forecast, and Slicing Rules. | For an event with a complicated course, the method breaks down the contributing factors along the timeline. It shows how conditions, decisions, and reactions together produce a course of events. | For a process, product, or service with noticeable failure risks, the method assesses possible failure modes in advance. It directs attention to combinations of occurrence, effect, and detectability. | For a problem with several suspected causes, the method builds a causal structure instead of a mere list. It makes visible how causes connect and where the strongest points of leverage lie. |
Complexitydifferent | Medium | High | High | Medium |
Timedifferent | laufend | 2-6 h | 2-6 h | 1-3 h |
Participantsdifferent | 2-12 | 3-10 | 3-10 | 2-8 |
Formatdifferent | Workshop + async | Workshop + async | Workshop | Workshop |
Outputdifferent | Throughput Data, Flow Forecast, Slicing Rules | Event Timeline, Causal Factor Chart, Cause List, Corrective Actions | FMEA Table, Risk Priority, Mitigation Actions | Cause Tree, Evidence Notes, Countermeasures |
Tagsno overlap | EstimationForecastingFlow | CausalityIncidentRoot causeTimeline | RiskQualityOperationsRoot cause | Root causeTreeIncidentQuality |