View methods side by side.
Choose up to four methods. Add them using the search and share the comparison by copying its link.
Selected:Leverage PointsC4 ModelATAM (Architecture Tradeoff Analysis Method)SAAM (Software Architecture Analysis Method)
| Criterion |  Systems Thinking Leverage Points | 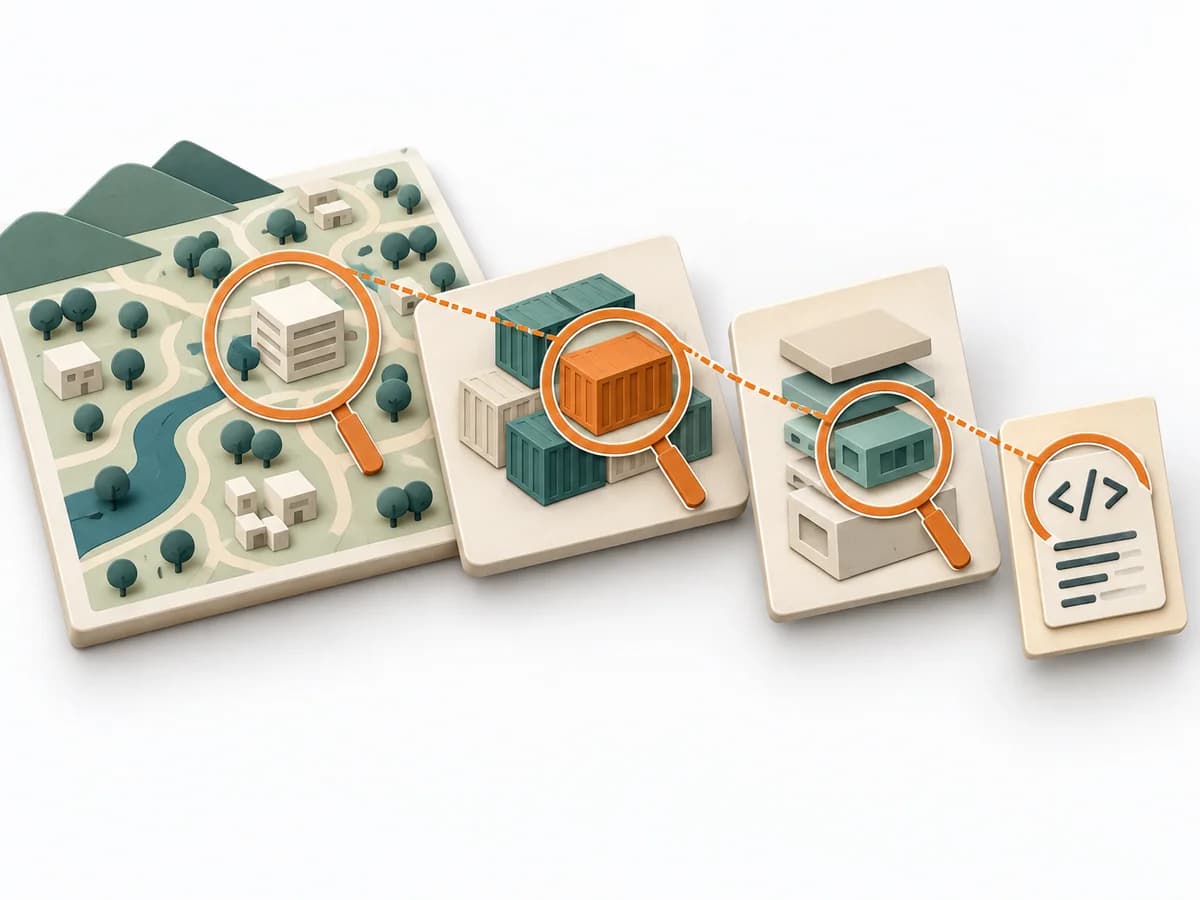 Architecture C4 Model |  Architecture ATAM (Architecture Tradeoff Analysis Method) |  Architecture SAAM (Software Architecture Analysis Method) |
|---|---|---|---|---|
Purposedifferent | Leverage Points show exactly where interventions in a system produce a disproportionate effect. It draws relationships, patterns, and feedback loops. The result is captured as a leverage map and action strategy. | The C4 Model makes a system legible across several resolution levels, from context down to code. It suits situations where different audiences need to understand the same architecture from different altitudes. | ATAM helps teams weigh architecture decisions when quality goals compete. The team considers business goals, stakeholder expectations, and technical decisions together. The evaluation shows which risks need further investigation. | SAAM helps teams judge an architecture’s suitability for selected tasks and changes. It is particularly useful for examining modifiability and comparing architecture alternatives with clear reasoning. |
Complexitydifferent | High | Low | High | High |
Timedifferent | Half day | 1-4 h | Several meetings plus preparation and analysis; total effort depends on scope | Preparation, scenario analysis, and findings review; effort depends on scope |
Participantsdifferent | 3-12 | 1-5 | Evaluation team, architects, and relevant stakeholders | Architecture experts and stakeholders for scenarios and weighting |
Formatdifferent | Workshop | Workshop + async | Workshop + async | Workshop + async |
Outputdifferent | Leverage Map, Action Strategy | Context Diagram, Container Diagram, Component Diagram | Prioritized quality scenarios in a utility tree, Architecture risks with reasoning and assumptions, Sensitivity and trade-off points, Findings report with open investigations | Domain functions mapped to components and connections, Quality attributes and evaluation criteria, Typical tasks and their effects on the architecture, Reasoned evaluation or comparison of alternatives |
Tagsno overlap | Systems thinkingChangeStrategy | ArchitectureCommunicationVisualization | ArchitectureQualityRiskTradeoffsStakeholders | ArchitectureChangeAnalysisComparisonQuality |