View methods side by side.
Choose up to four methods. Add them using the search and share the comparison by copying its link.
| Criterion | 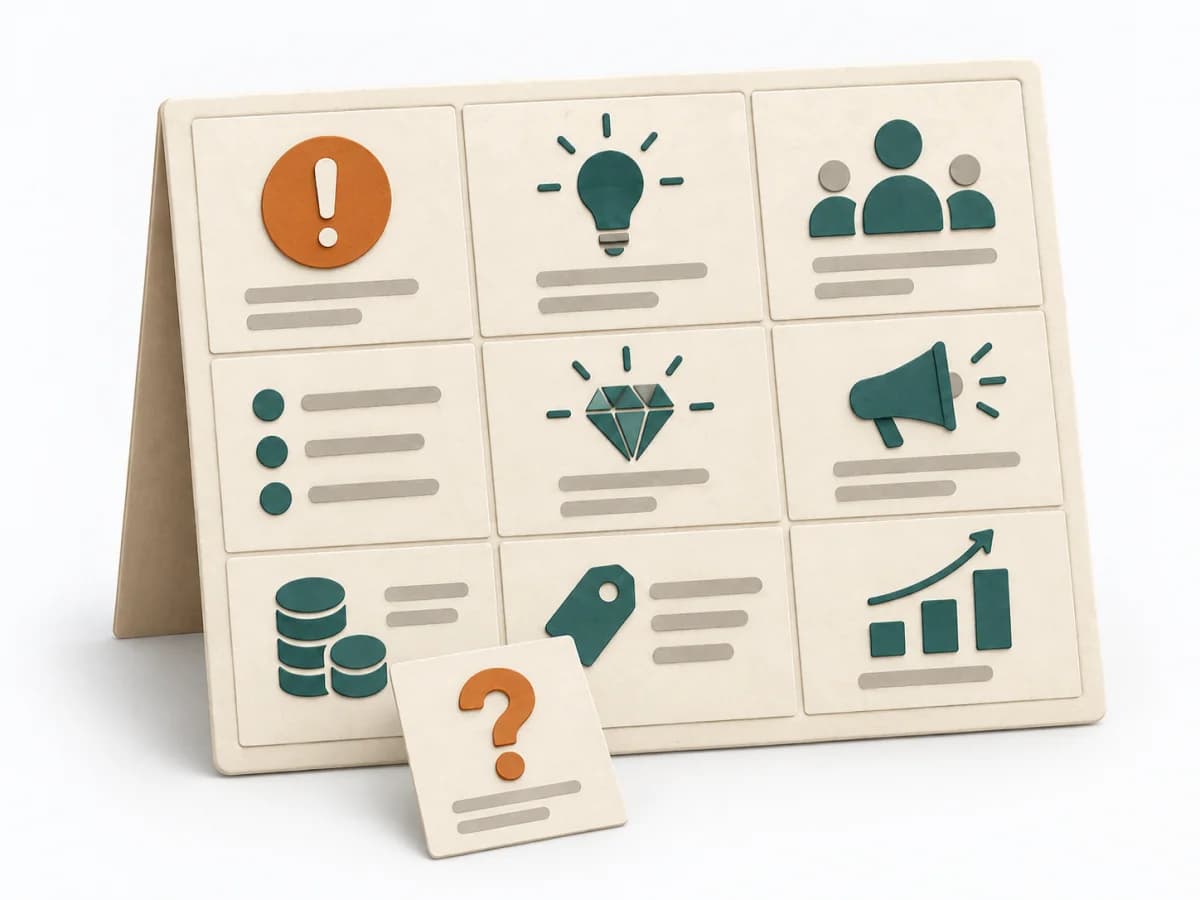 Product Strategy Lean Canvas | 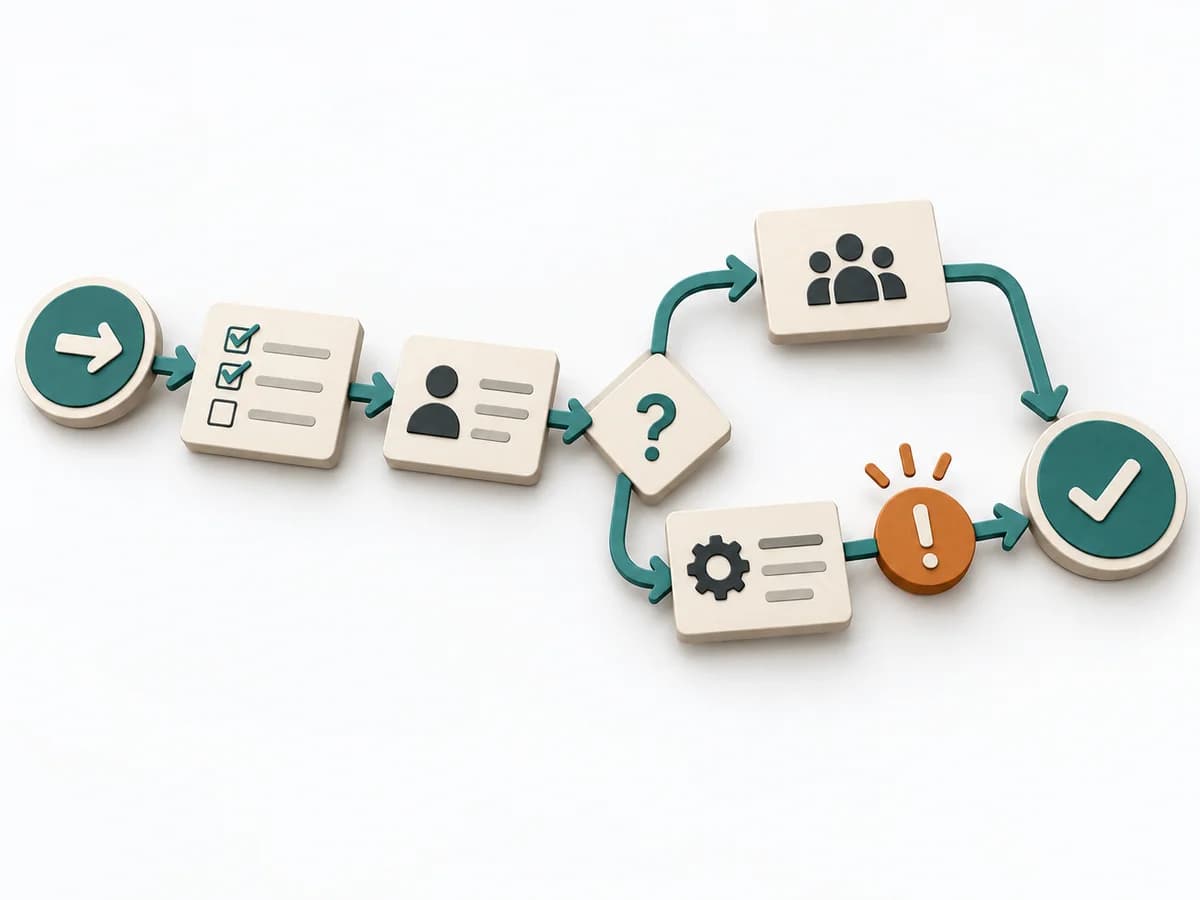 Operations Process Mapping | 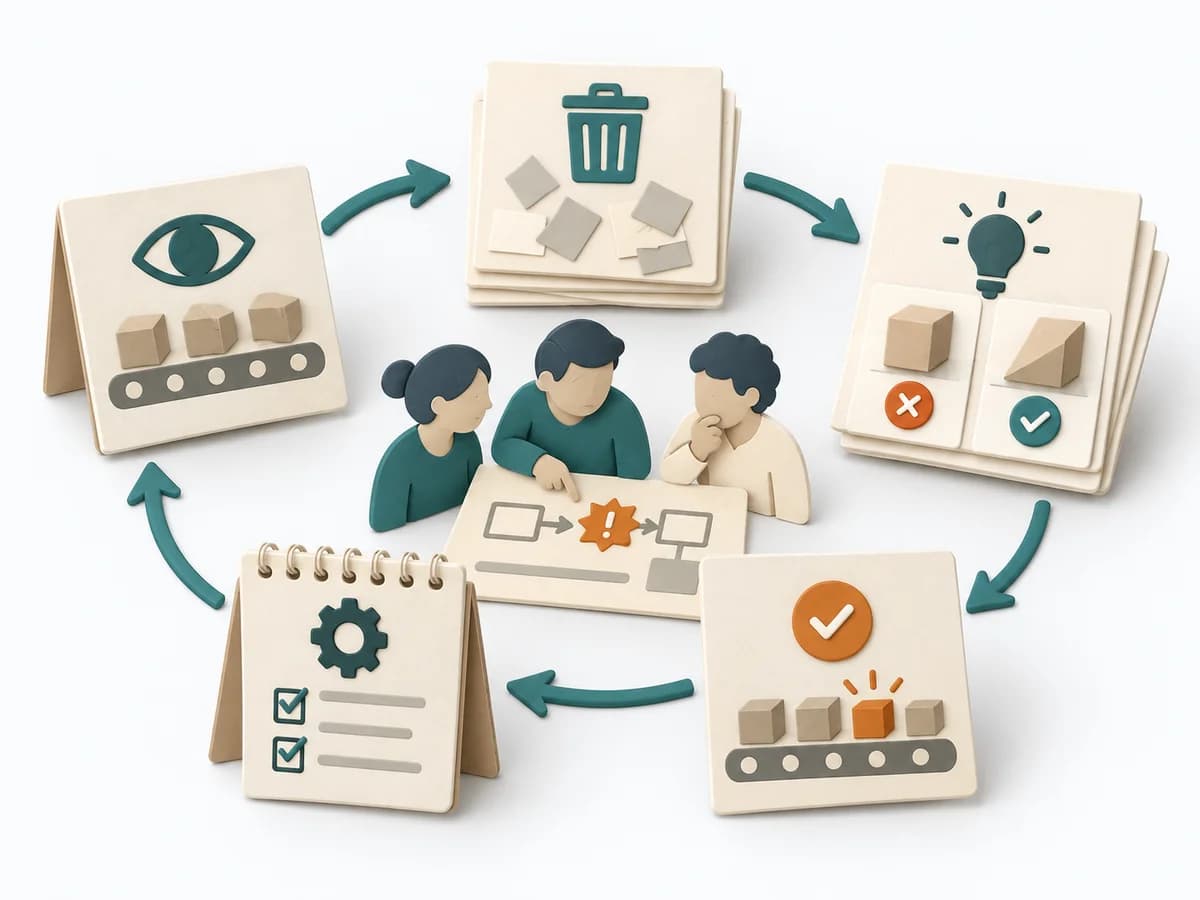 Operations Kaizen Event | 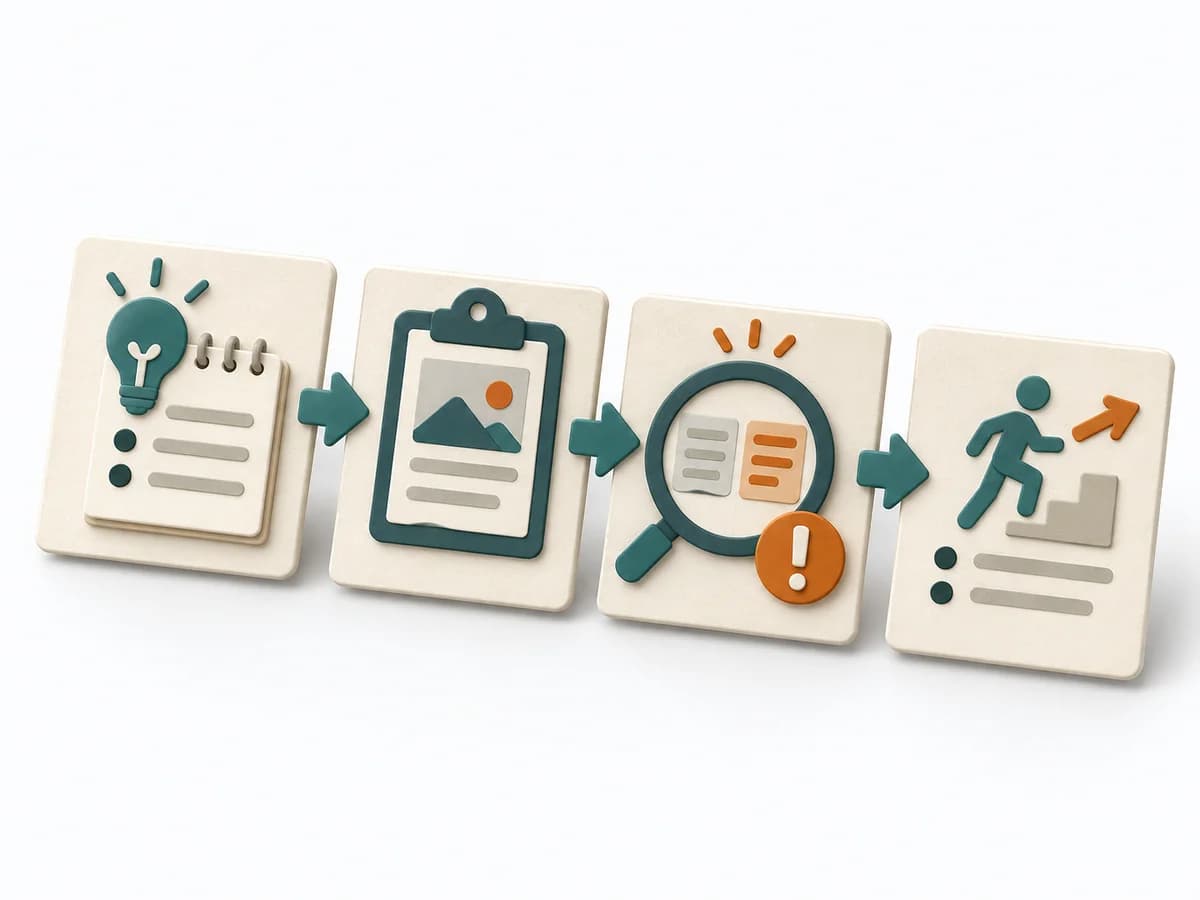 Operations After-Action Review |
|---|---|---|---|---|
Purposedifferent | When an early product bet still has too many open points, it brings target group, problem, and assumptions into a single view. It condenses the idea so core risks become nameable. | With a confusing workflow that has many handoffs, the method makes the actual process visible. It shows where work is passed on, delayed, or duplicated, so improvement targets the right spots. | For a tightly scoped process segment with noticeable waste, the method bundles shared energy for change. It suits situations that call for fast learning loops and visible adjustments. | After missions or project phases with unclear outcomes, the method makes visible what actually happened and what can be learned from it. It separates course, effect, and causes so experience turns into solid improvement. |
Complexitydifferent | Medium | Medium | Medium | Low |
Timedifferent | 45-90 min | 1-3 h | 0.5-5 Tage | 20-45 min |
Participantsdifferent | 1-6 | 3-10 | 4-10 | 3-12 |
Formatdifferent | Workshop + async | Workshop | Workshop | Workshop + async |
Outputdifferent | Lean Canvas, Core Assumptions, Experiment Backlog | Process Map, Handoff List, Improvement Backlog | Kaizen Charter, Waste List, Improvement Experiments, Standard Work Update | Lessons learned, Action items, Event summary |
Tagsno overlap | StartupLeanAssumptionsBusiness model | ProcessOperationsImprovement | LeanContinuous improvementOperations | LearningOperationsImprovement |